Resources
A curated set of tools and templates to help you produce brand-compliant charts, maps and graphics across the software you already use, from Excel and PowerPoint to Power BI, Adobe Illustrator and GIS. You'll also find shared assets, icons and code-based workflows for reproducible outputs.

MS Office
MS Office offers a range of tools for communication, presentation and data visualization. They include various types of charts, such as Column, Bar and Pie charts, and much more. In this section, you will find customized themes and chart templates that will help to avoid default styles and facilitate the creation of UNHCR-branded charts.
Learn more Download template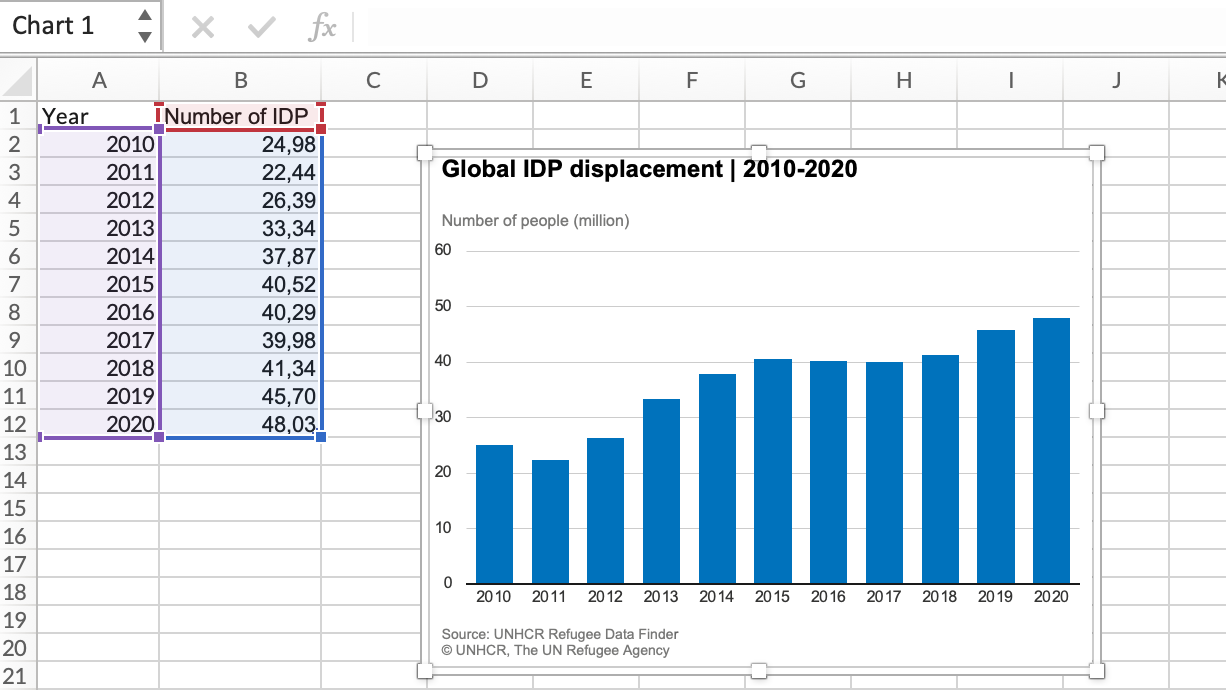

Power BI
Power BI is a collection of software services, apps and connectors that work together to turn your unrelated sources of data into coherent, visually immersive and interactive insights. Power BI Desktop is a desktop application you can install that works cohesively with the Power BI service by providing advanced data exploration, shaping, modelling and report creation with highly interactive visualizations.
Learn more Download template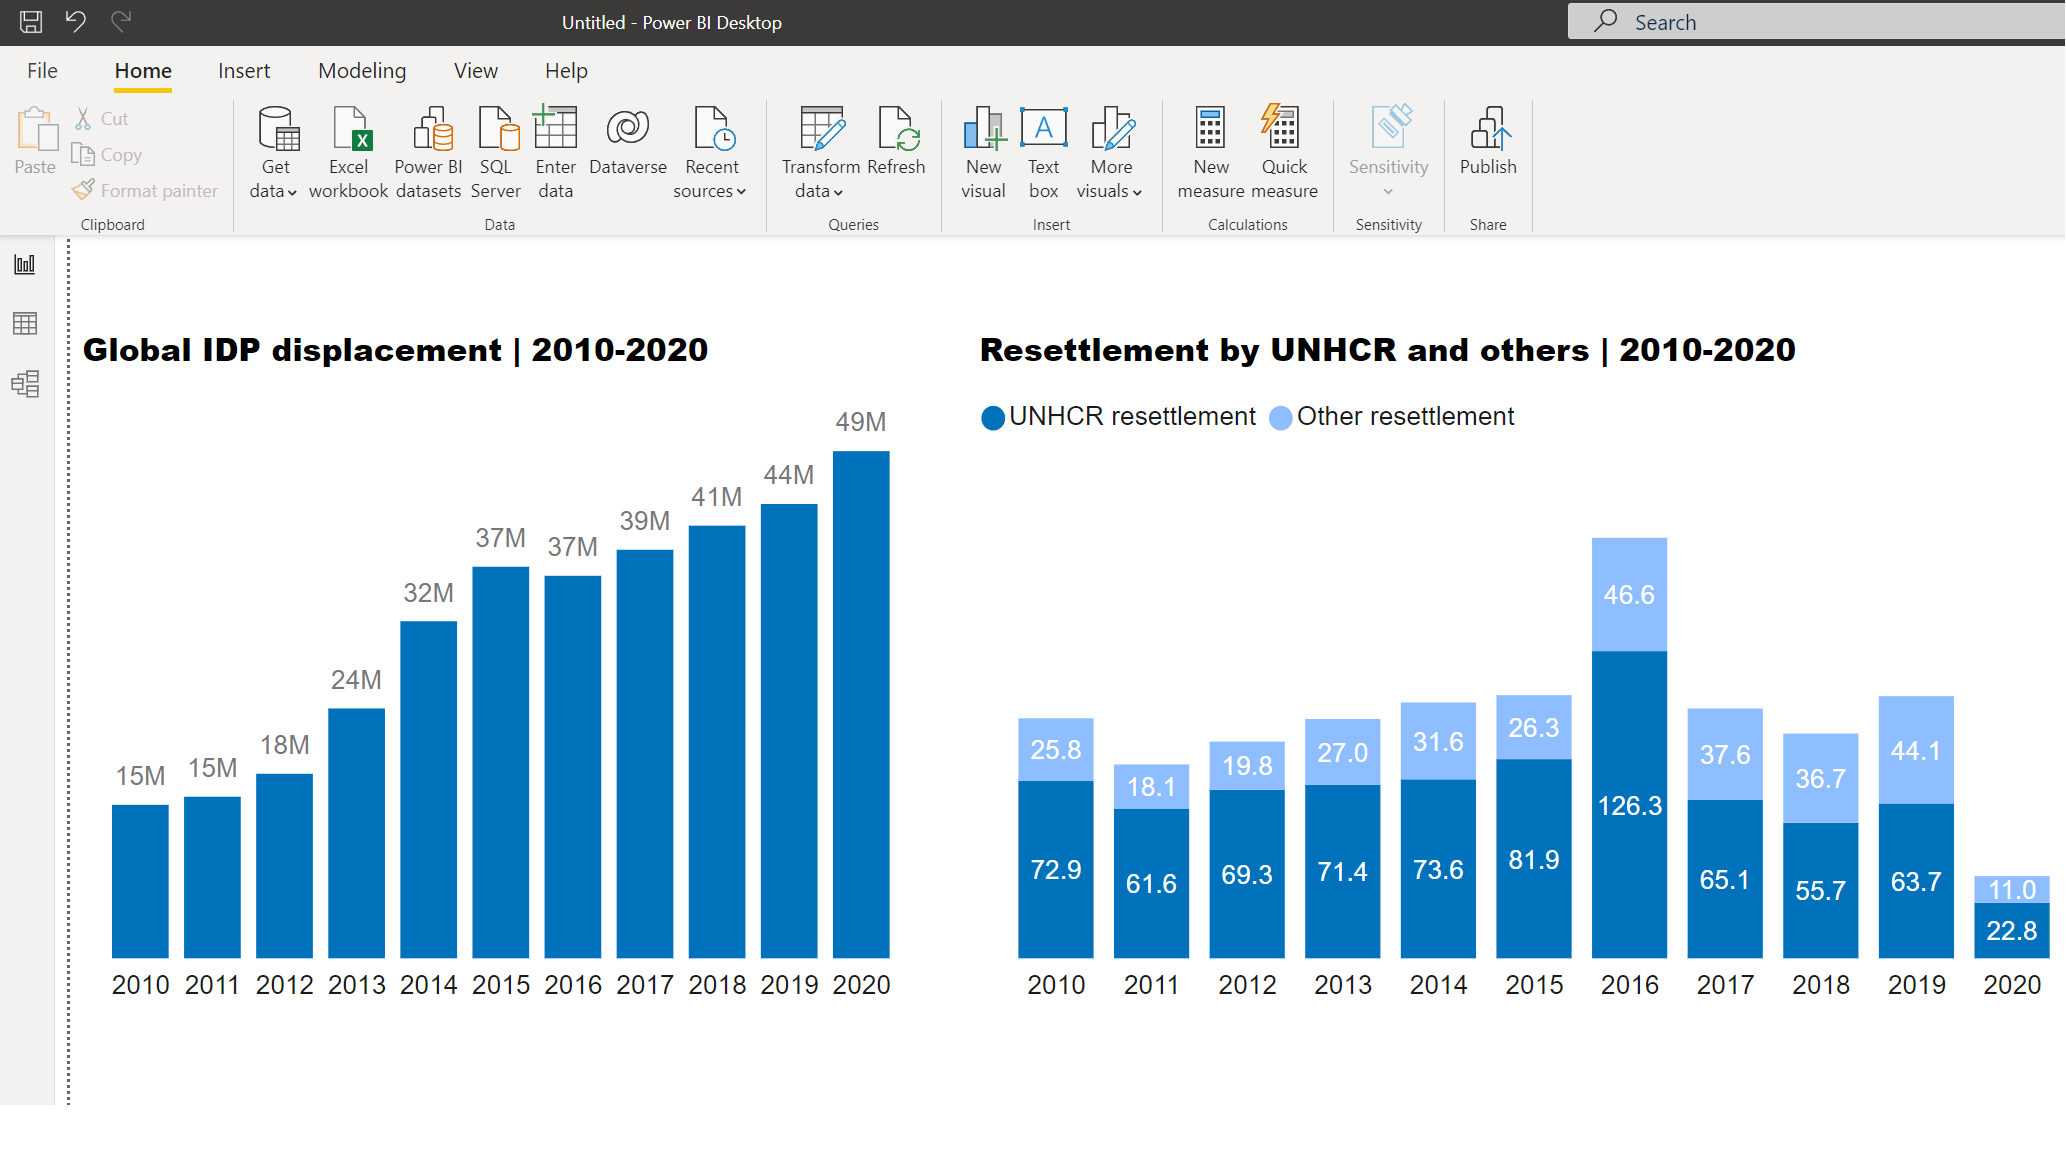

Illustrator
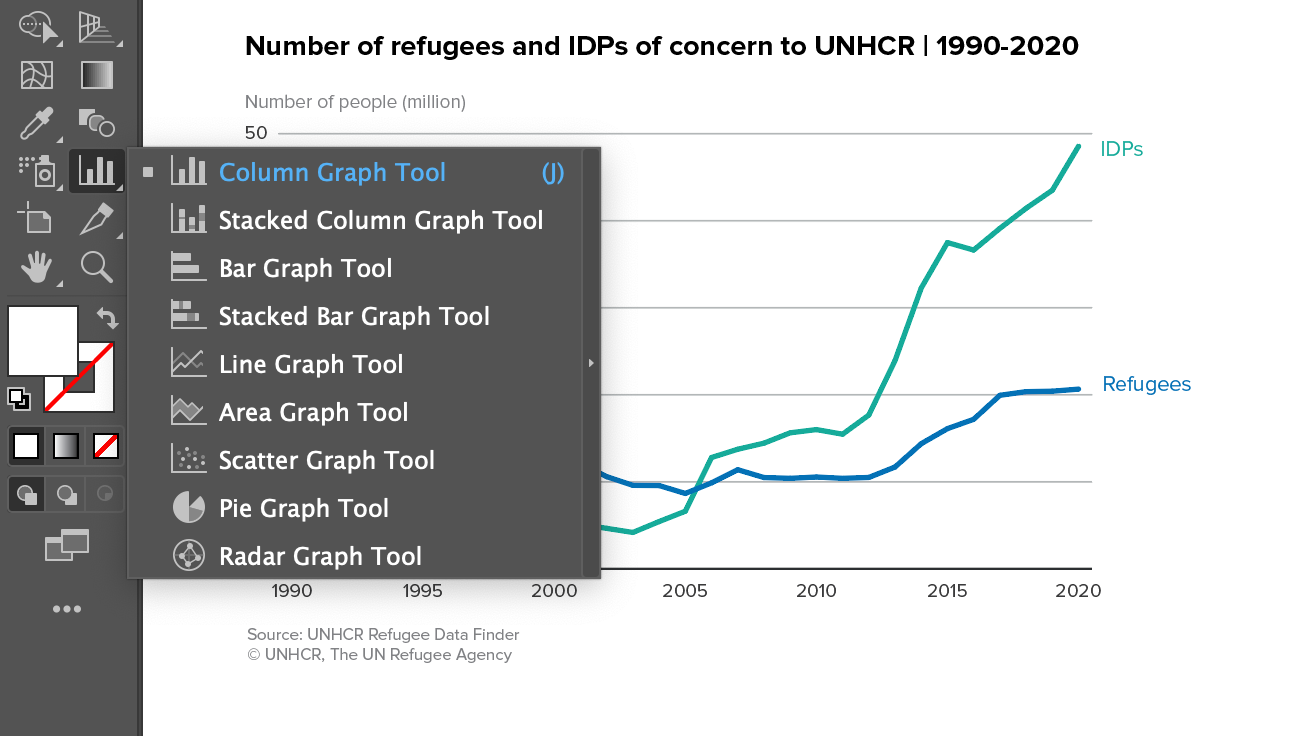
Adobe Illustrator is a powerful vector graphics editor and design program used to create logos, communication content, and infographics. Adobe Illustrator offers limitless possibilities for creativity and an easy way to develop graphs, charts, and custom graphics. If you’re already experienced in using Adobe Illustrator and now want to use it for creating charts and dashboards in the UNHCR style, then these tools and templates are made for you.
Learn more Download templateAdditional tools: OCHA Humanitarian DataViz Tool, Illustrator plugin to create charts directly in Illustrator.
For more information on Adobe Creative Cloud licenses check UNHCR Intranet page.

GIS services
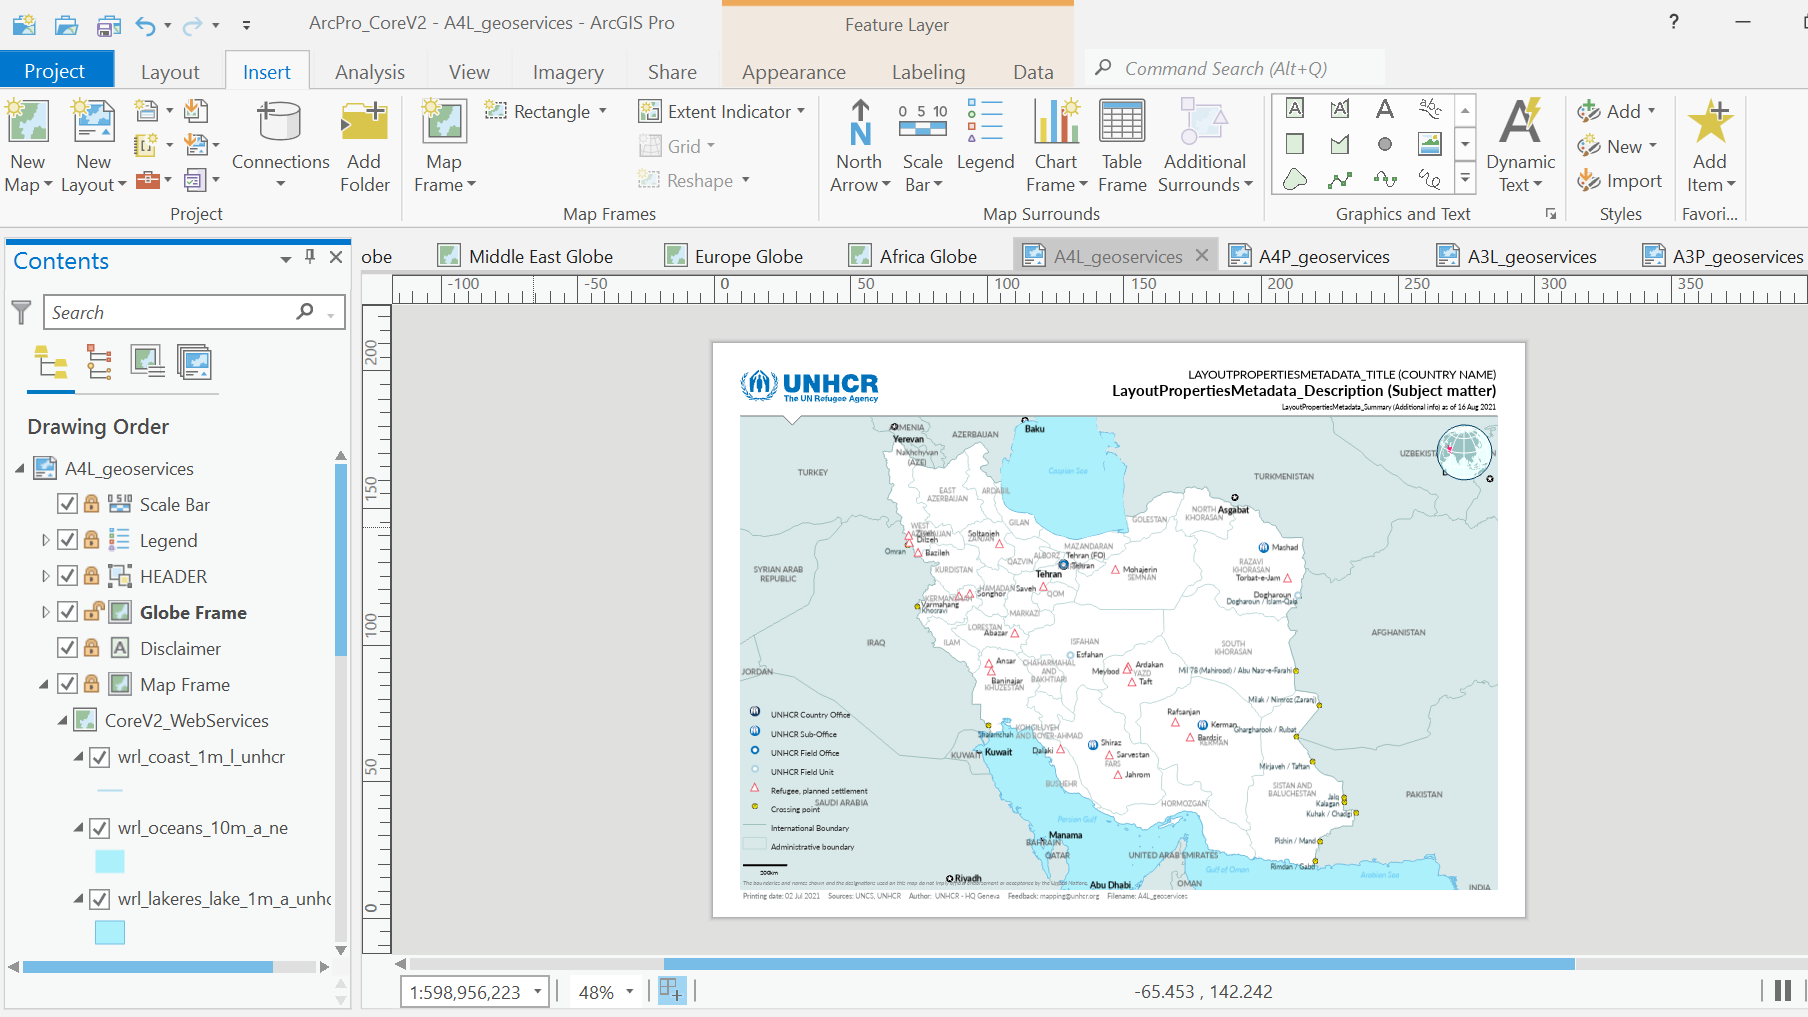
Geographic Information Systems (GIS) is a powerful tool for managing and visualizing spatial data. Visualizing spatial/location based data usually involves a map. UNHCR has a number of templates, symbology and tools for creating professional and effective maps in several different GIS software.
Tools and Services Download mapping guidelinesRequest your ArcGIS Pro license by contacting the GIS Support Unit.
Other resources
A set of additional resources to support data visualization work at UNHCR. The first group gathers shared assets and guidance applicable across tools, while the second focuses on code-based workflows for reproducible, scalable, and web-based outputs.
General Resources
- UNHCR Data Visualization Webinars - A series of webinars to help you understand what makes a good UNHCR brand-compliant infographic.
- UNHCR Brand Assets - A collection of all the UNHCR brand assets you may need for your day-to-day work.
- UNHCR GIS Templates and Webinars - Resources that include guidance, templates, symbology, and webinars for professional and effective GIS mapping.
- Humanitarian Icons - Icons developed by UN OCHA as a shared resource for all UN organizations.
Code-based Workflows
Resources for producing reproducible, scalable, and web-based data visualizations using code. These workflows are well suited for recurring products, automated pipelines, and custom outputs.
- unhcrdown - R package providing R Markdown templates for branded UNHCR reports and documents.
- refugees - R package providing direct access to UNHCR Refugee Data Finder API.
- quarto-html-unhcr - Quarto extension to produce branded HTML reports aligned with UNHCR's visual identity.
- quarto-revealjs-unhcr - Quarto extension to produce branded Reveal.js presentations aligned with UNHCR's visual identity.
- UNHCR Observable Collection - A collection of Observable notebooks providing UNHCR chart themes and reusable examples for interactive visualizations using Observable Plot.
Looking for chart styling packages for R or Python? See the R and Matplotlib tutorials.