Tutorials
Reproducible code examples to create UNHCR-branded charts in the scripting language of your choice, from static plots for reports to interactive visualizations for the web. Each example comes with ready-to-run code you can adapt to your own data.

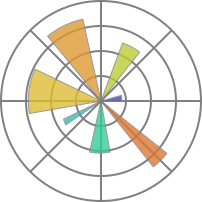
Matplotlib
Matplotlib is a comprehensive Python library for creating static, animated and interactive visualizations, built on NumPy and...

Plotly Python
Plotly Python is an open-source graphing library that allows you to create interactive visualizations in the web browser, from...