Bar chart
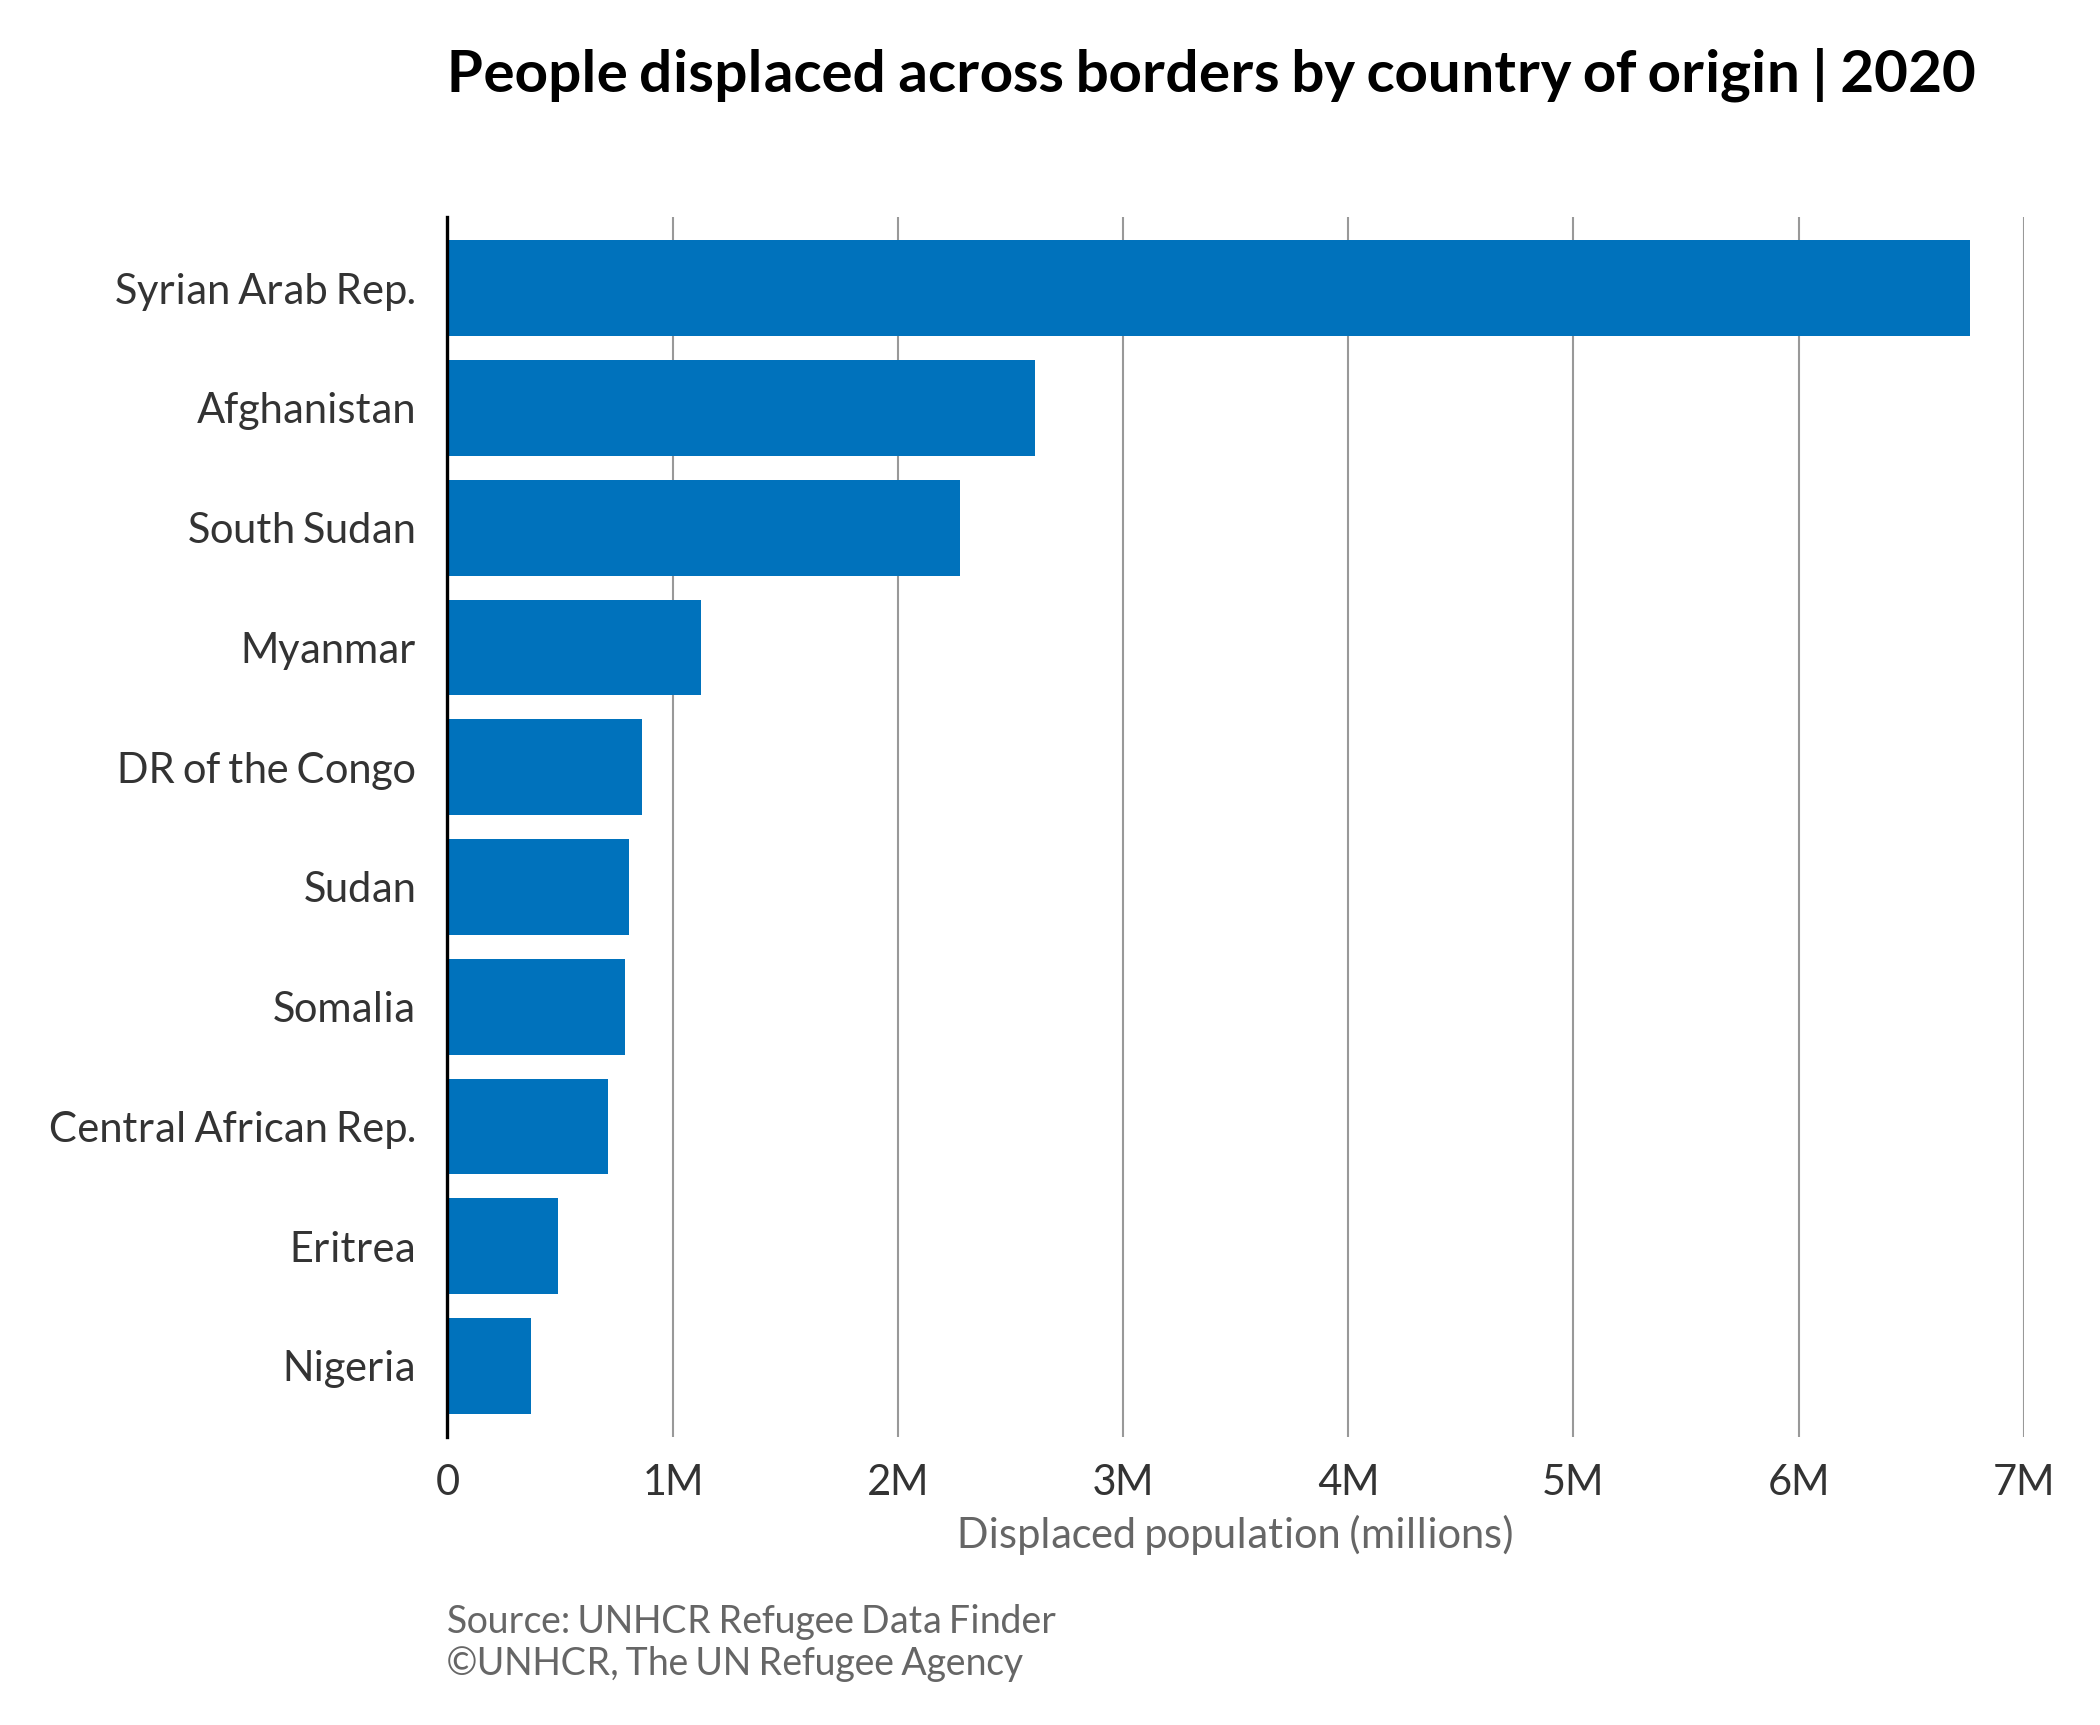
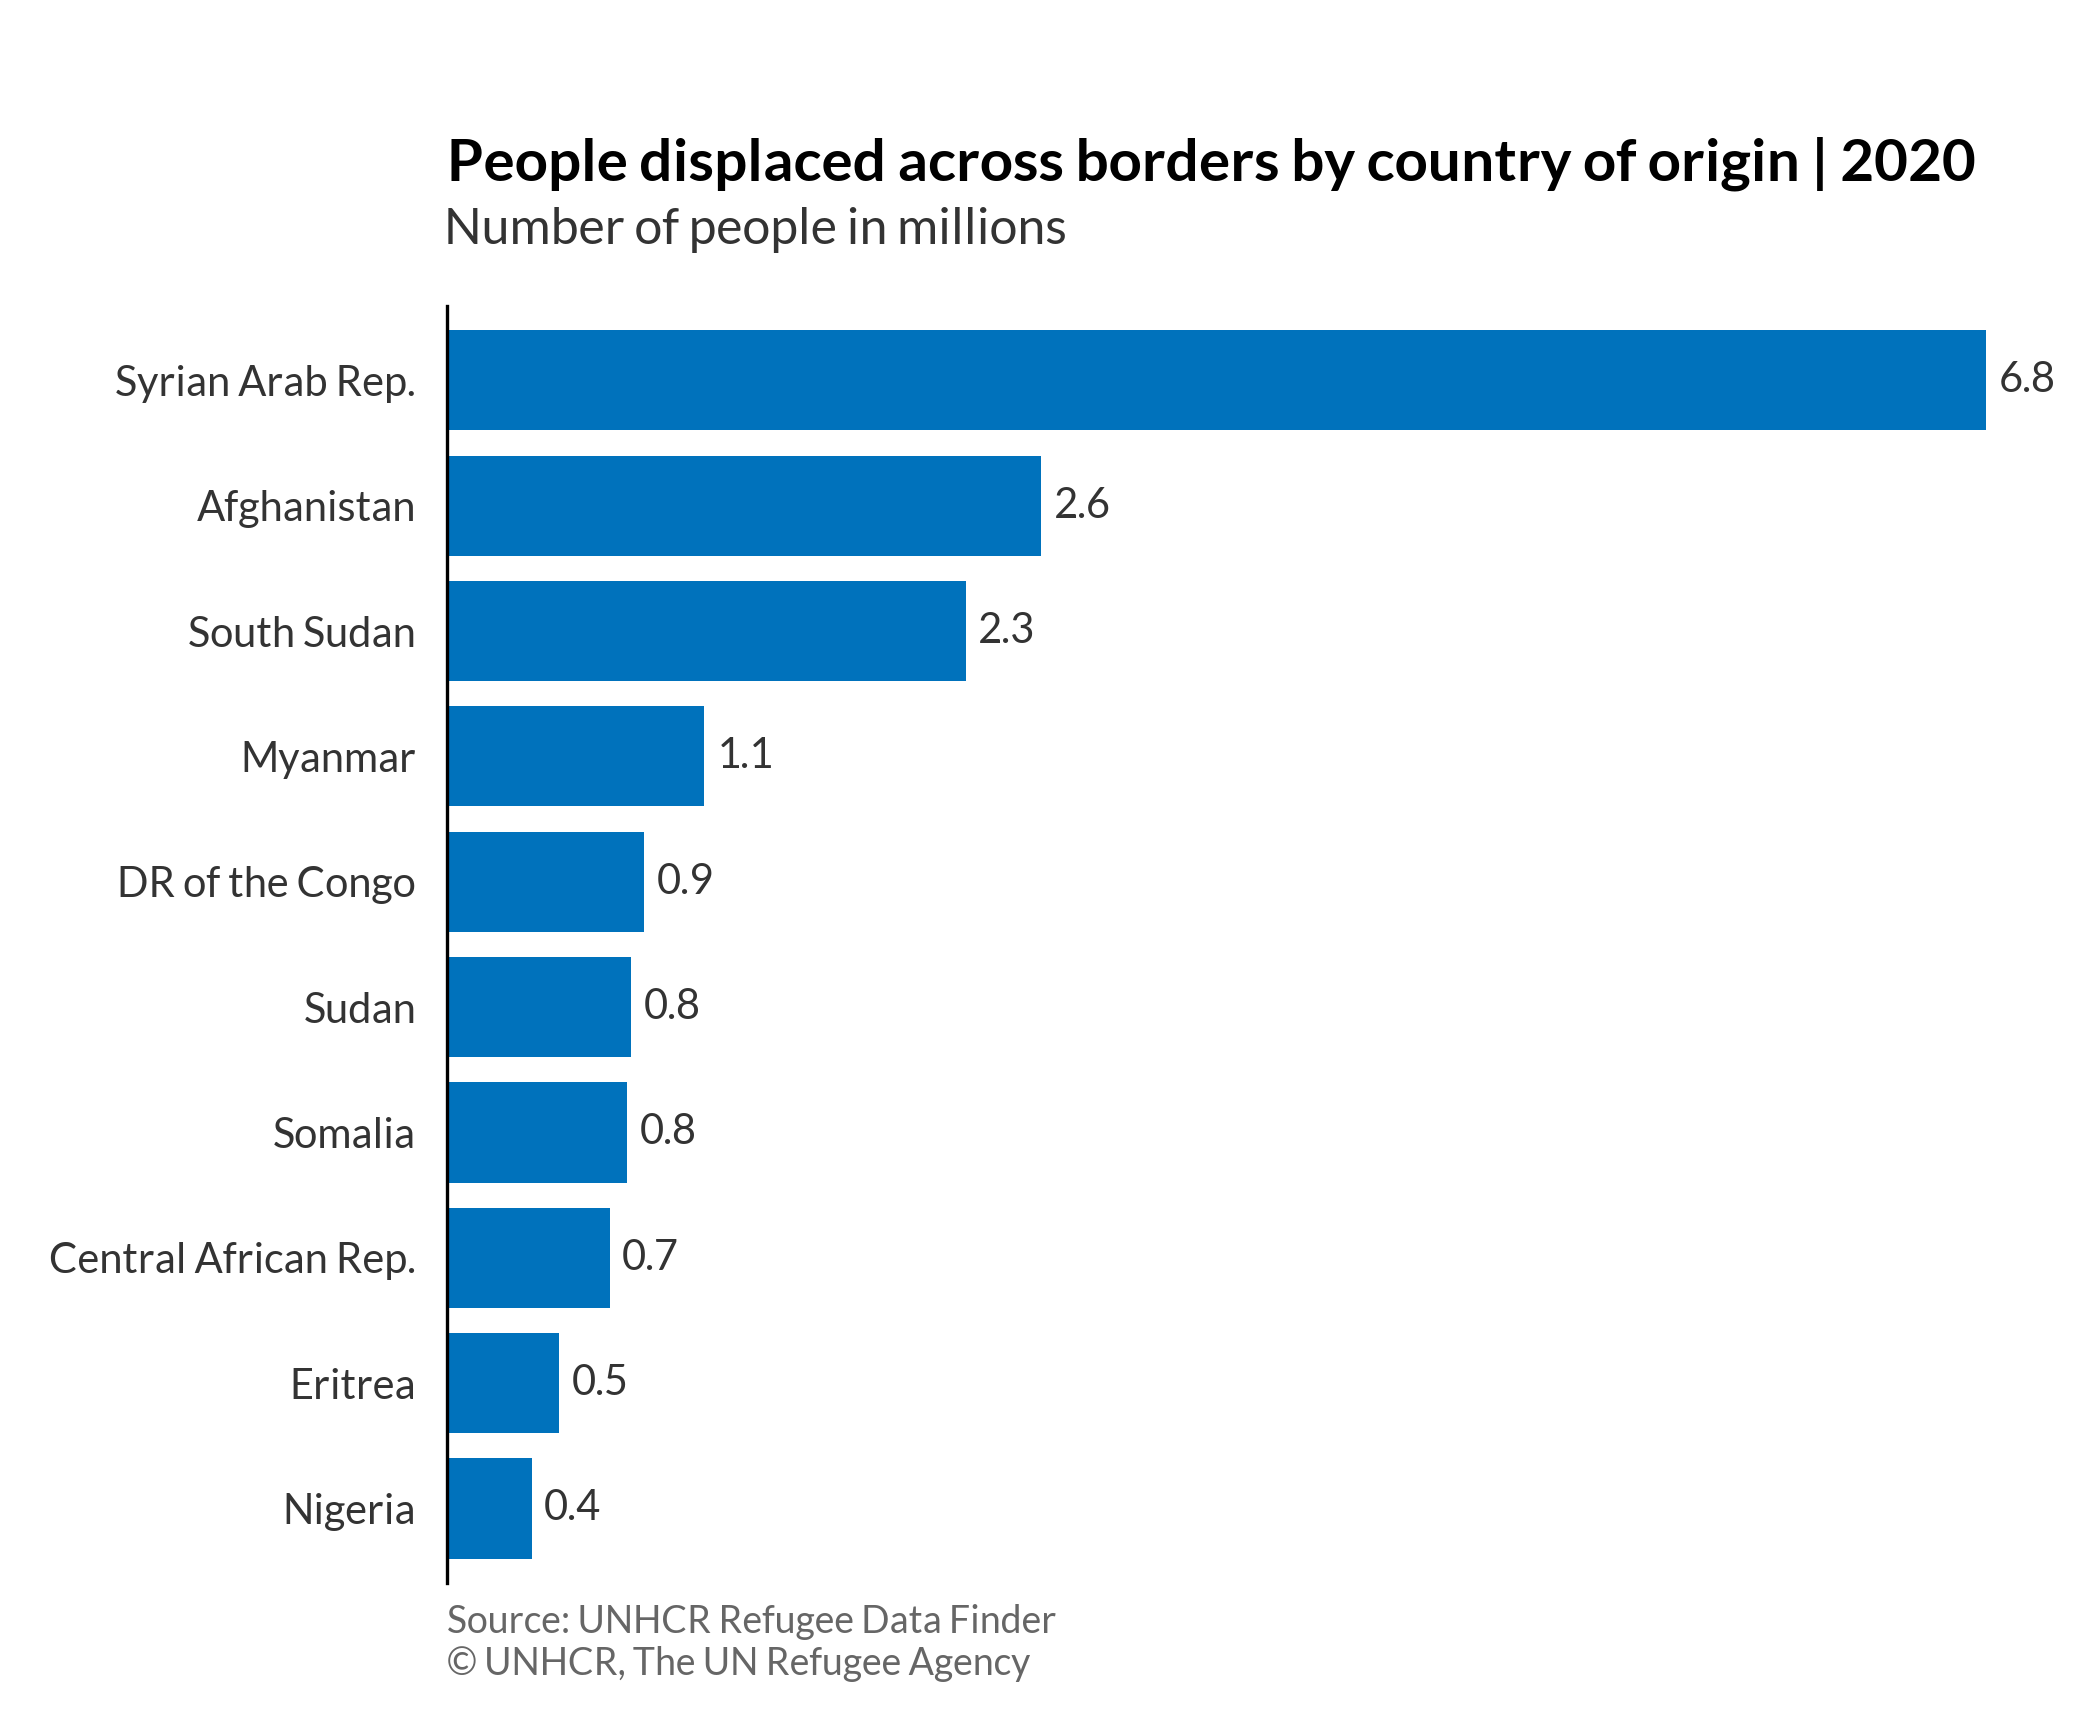
A bar chart is a chart in which each category is represented by a horizontal rectangle, with the length of the rectangle proportional to the values being plotted. The horizontal axis shows data value, and the vertical axis displays the categories being compared.
More about: Bar chart - Other tutorials: R Plotly Python D3
Basic bar chart
# import libraries
import matplotlib.pyplot as plt
import pandas as pd
from textwrap import wrap
plt.style.use(['unhcrpyplotstyle', 'bar'])

# load data set
df = pd.read_csv('https://raw.githubusercontent.com/GDS-ODSSS/unhcr-dataviz-platform/master/data/comparison/bar.csv')

# sort value in descending order
df.sort_values('displaced_number', inplace=True)

# prepare data array for plotting
x = df['country_origin']
y = df['displaced_number']

# wrap long labels
x = ['\n'.join(wrap(l, 20)) for l in x]

# plot the chart
fig, ax = plt.subplots()
bar_plot = ax.barh(x, y)

# set chart title
ax.set_title('People displaced across borders by country of origin | 2020')

# set x-axis title
ax.set_xlabel('Displaced population (millions)')

# set x-axis label
ax.tick_params(labelbottom=True)

# set x-axis limit
xlimit = plt.xlim(0, 7000000)

# show grid below the bars
ax.grid(axis='x')

# format x-axis tick labels
def number_formatter(x, pos):
    if x >= 1e6:
        s = '{:1.0f}M'.format(x*1e-6)
    elif x < 1e6 and x >= 1e3:
        s = '{:1.0f}K'.format(x*1e-3)
    else:
        s = '{:1.0f}'.format(x)
    return s
ax.xaxis.set_major_formatter(number_formatter)

# set chart source and copyright
plt.annotate('Source: UNHCR Refugee Data Finder', (0,0), (0, -40), xycoords='axes fraction', textcoords='offset points', va='top', color = '#666666', fontsize=9)
plt.annotate('©UNHCR, The UN Refugee Agency', (0,0), (0, -50), xycoords='axes fraction', textcoords='offset points', va='top', color = '#666666', fontsize=9)

# adjust chart margin and layout
fig.tight_layout()

# Save the figure to the specified path
fig.savefig('plot/bar-basic.png')

# show chart
plt.show()
Bar chart with data label
# import libraries
import matplotlib.pyplot as plt
import pandas as pd
from textwrap import wrap
plt.style.use(['unhcrpyplotstyle','bar'])

#load data set
df = pd.read_csv('https://raw.githubusercontent.com/GDS-ODSSS/unhcr-dataviz-platform/master/data/comparison/bar.csv')

#sort value in descending order
df.sort_values('displaced_number', inplace=True)

#prepare data array for plotting
x = df['country_origin']
y = df['displaced_number']

#wrap long labels
x = [ '\n'.join(wrap(l, 20)) for l in x ]

#plot the chart
fig, ax = plt.subplots()
bar_plot = ax.barh(x, y)

#set chart title
ax.set_title('People displaced across borders by country of origin | 2020')

#set subtitle
plt.suptitle('Number of people in millions', x=0.36, y=0.88)

# set formatted data label
ax.bar_label(bar_plot, labels=[f'{x*1e-6:,.1f}' for x in bar_plot.datavalues], padding=3)

#set chart source and copyright
plt.annotate('Source: UNHCR Refugee Data Finder', (0,0), (0, -5), xycoords='axes fraction', textcoords='offset points', va='top', color = '#666666', fontsize=9)
plt.annotate('© UNHCR, The UN Refugee Agency', (0,0), (0, -15), xycoords='axes fraction', textcoords='offset points', va='top', color = '#666666', fontsize=9)

#adjust chart margin and layout
fig.tight_layout()

# Save the figure to the specified path
fig.savefig('plot/bar-labels.png')

#show charts
plt.show()
Column chart
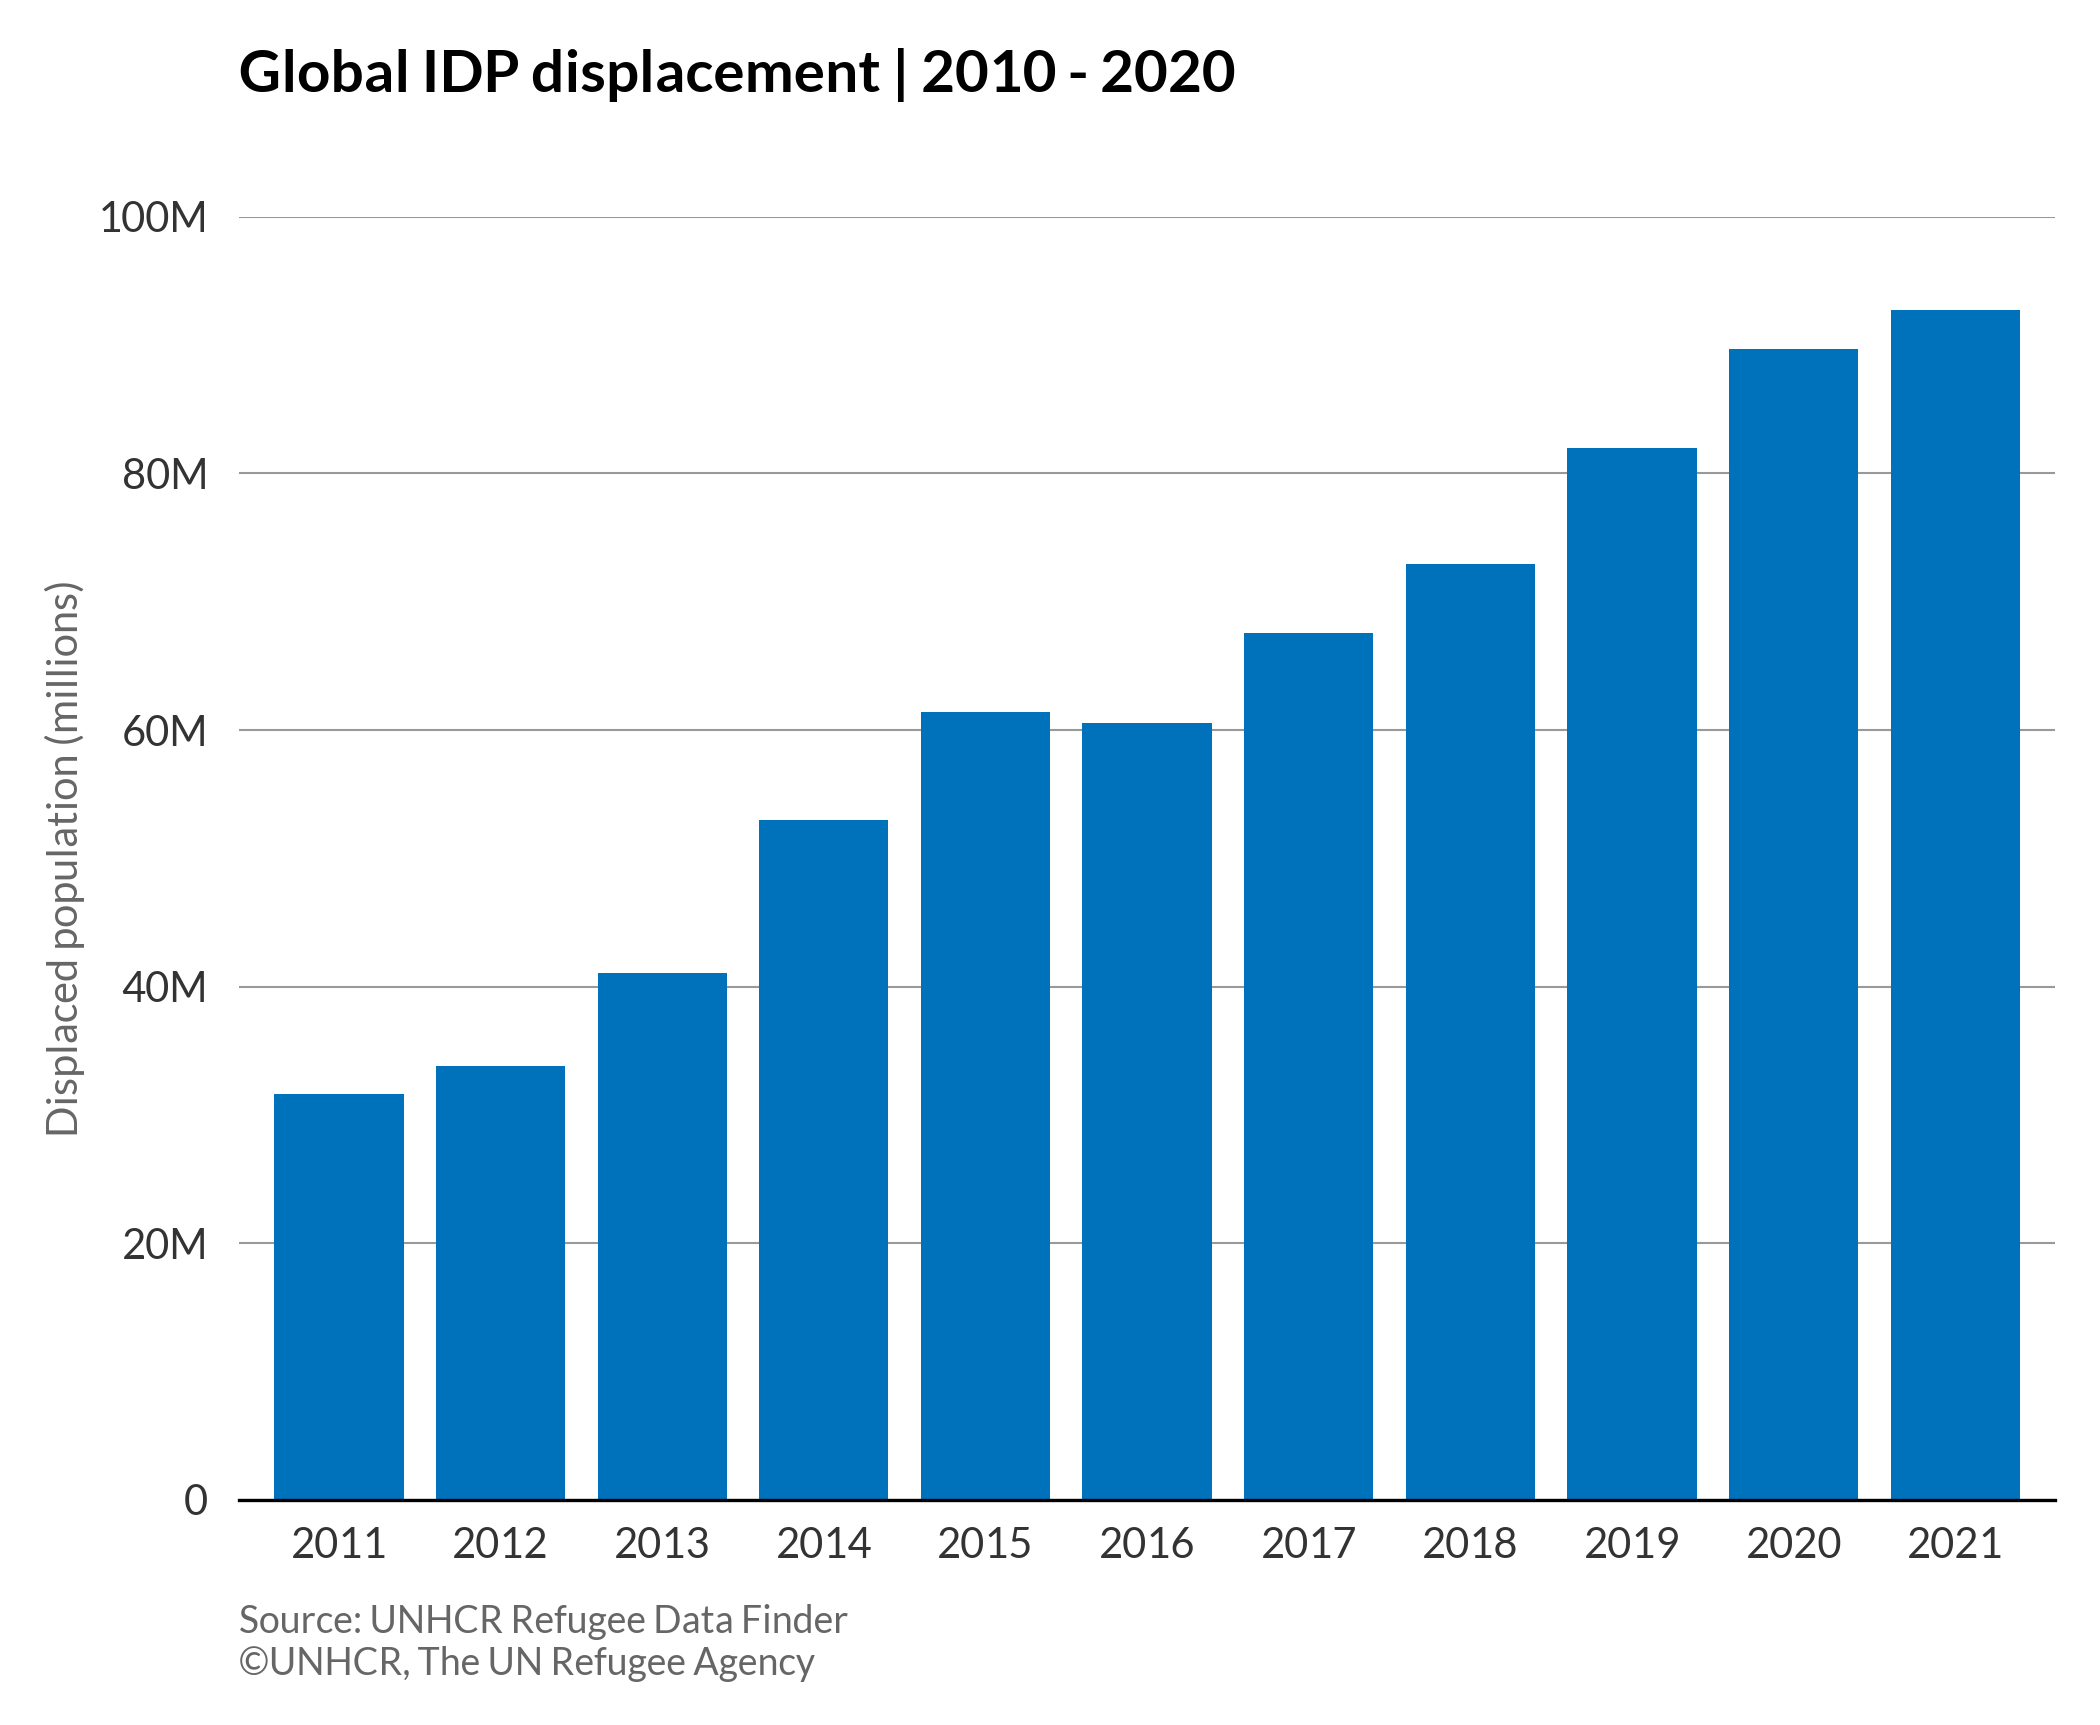
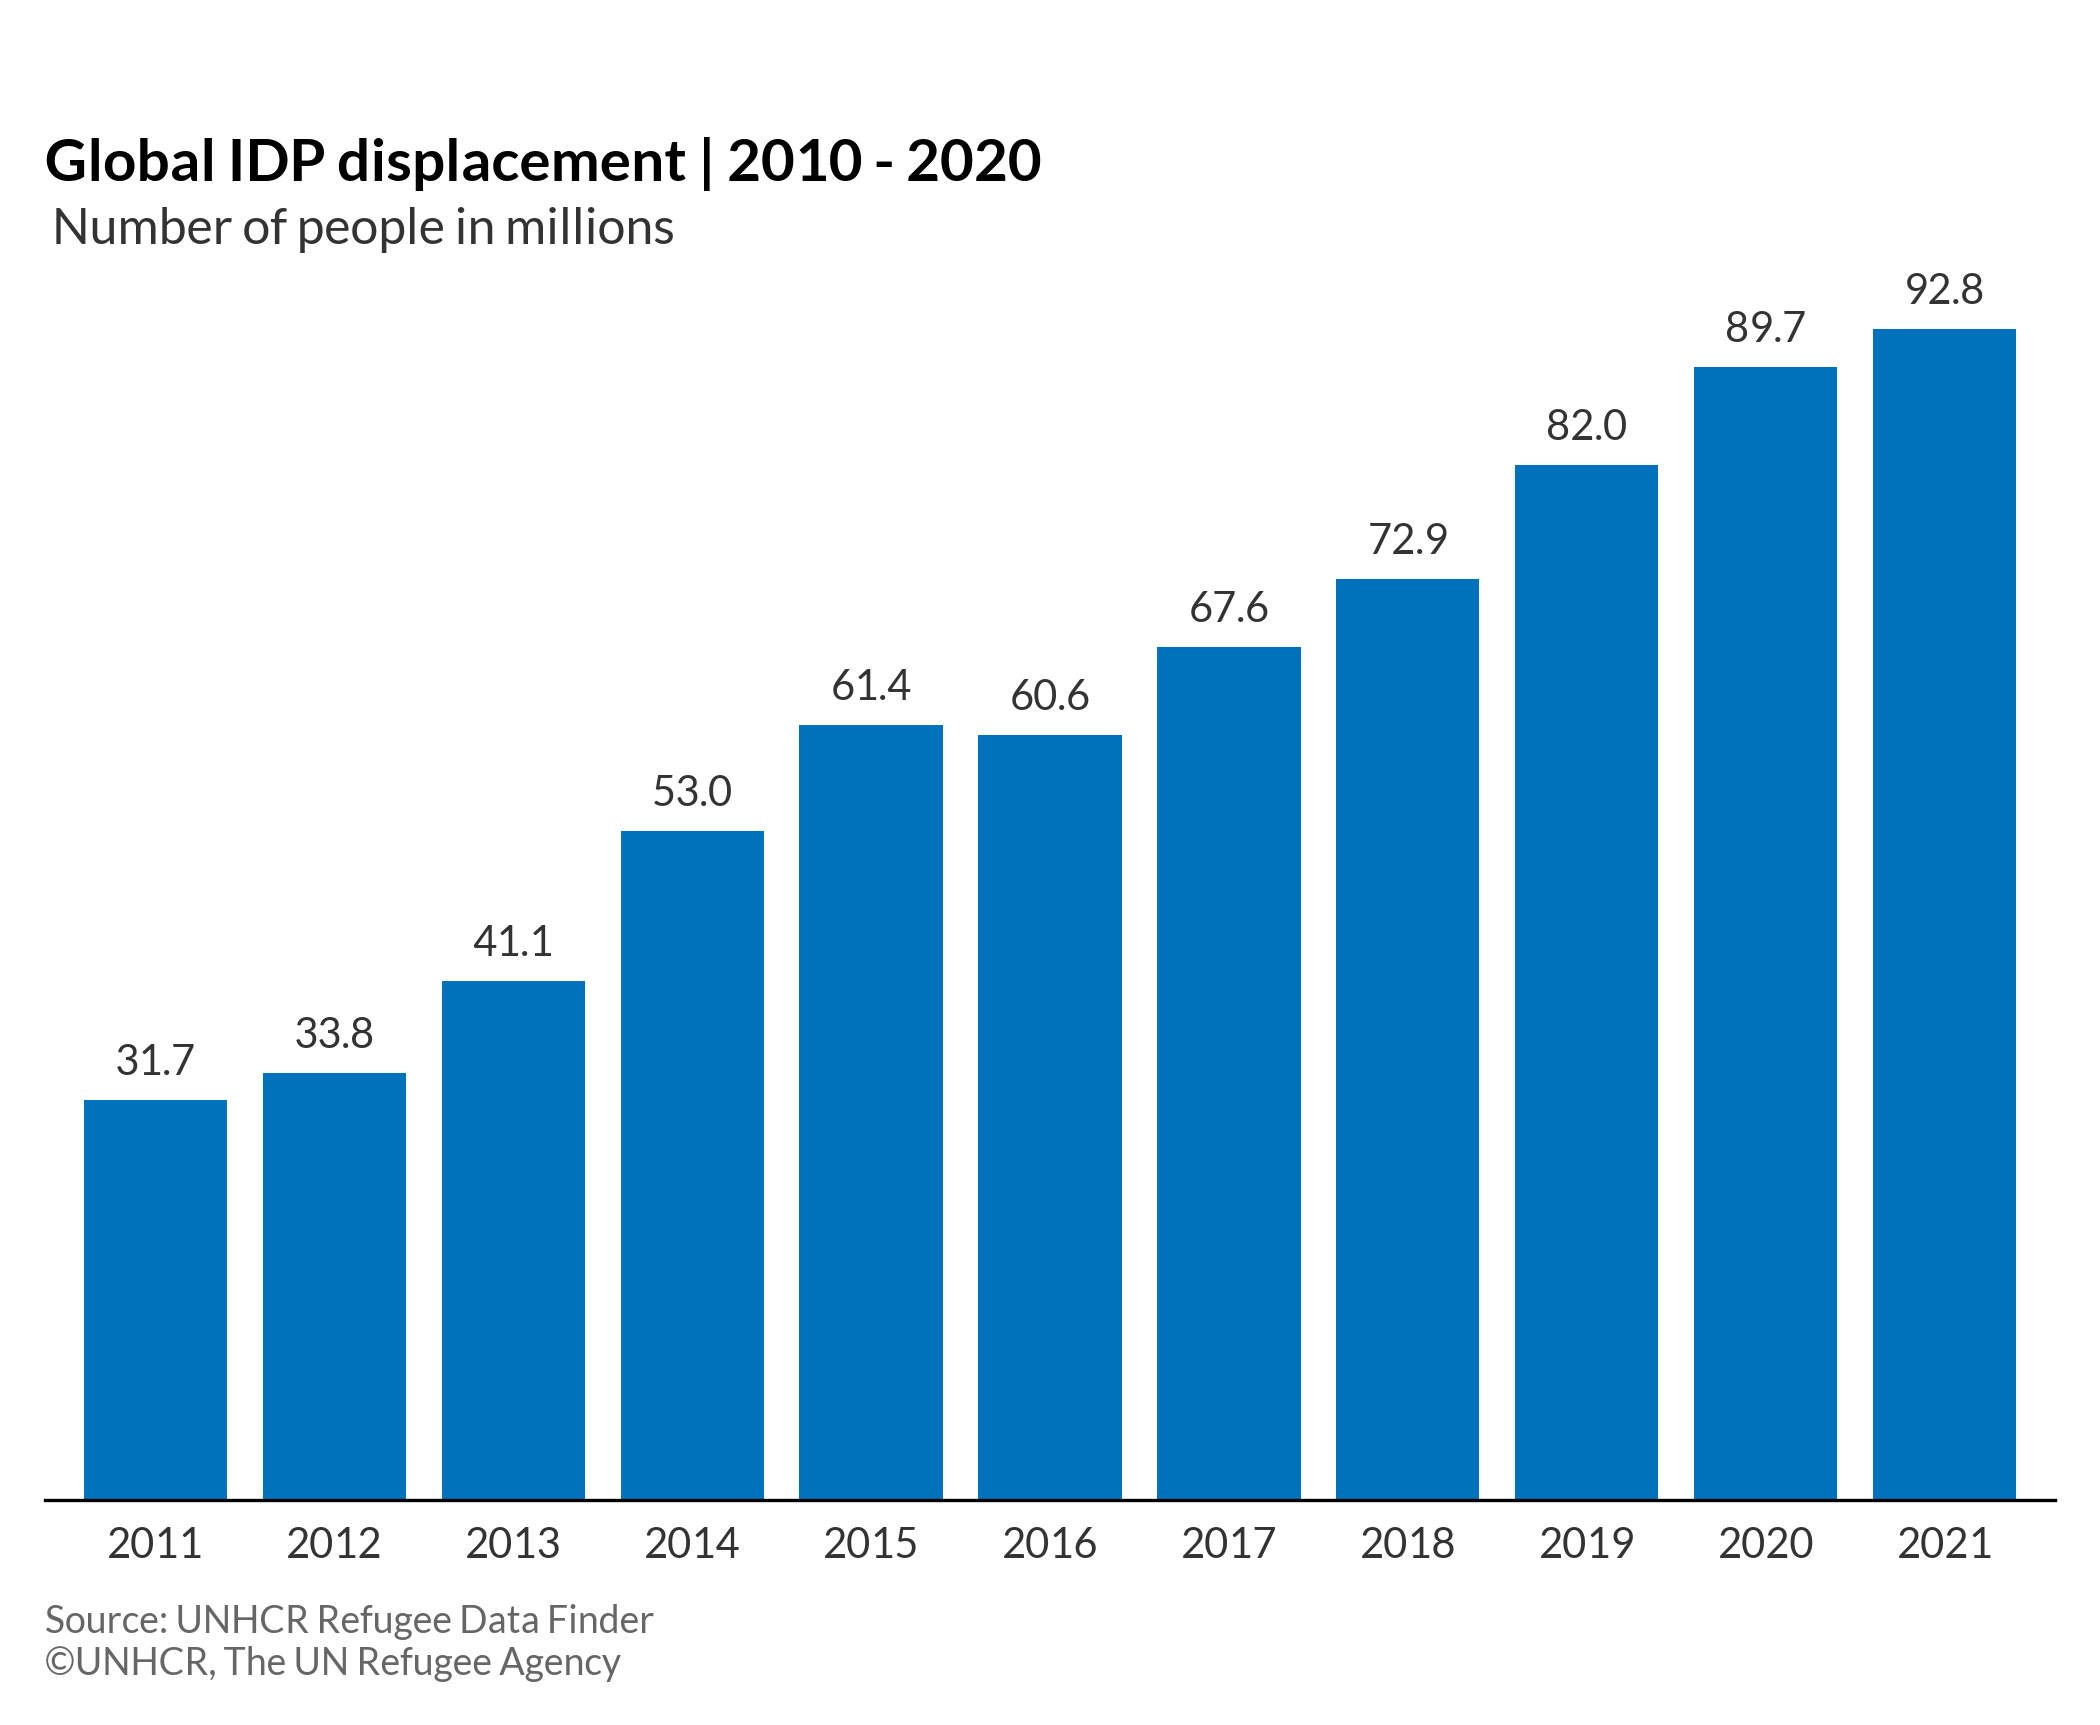
In a column chart, each category is represented by a vertical rectangle, with the height of the rectangle being proportional to the values being plotted.
More about: Column chart - Other tutorials: R Plotly Python D3
Basic column chart
# import libraries
import matplotlib.pyplot as plt
import pandas as pd
plt.style.use(['unhcrpyplotstyle','column'])

#load data set
df = pd.read_csv('https://raw.githubusercontent.com/GDS-ODSSS/unhcr-dataviz-platform/master/data/comparison/column.csv')

#compute data array for plotting
x = df['year']
y = df['displaced_number']

#plot the chart
fig, ax = plt.subplots()
bar_plot = ax.bar(x, y)

#set chart title
ax.set_title('Global IDP displacement | 2010 - 2020')

#set y-axis title
ax.set_ylabel('Displaced population (millions)')

#set y-axis labels
ax.tick_params(labelleft=True)

#set y-axis limit
ylimit = plt.ylim(0, 100*1e6)

#set tick based on x value
ax.set_xticks(x)

#set grid
ax.grid(axis='y')

#format y-axis tick labels
def number_formatter(x, pos):
    if x >= 1e6:
        s = '{:1.0f}M'.format(x*1e-6)
    elif x < 1e6 and x >= 1e3:
        s = '{:1.0f}K'.format(x*1e-3)
    else:
        s = '{:1.0f}'.format(x)
    return s
ax.yaxis.set_major_formatter(number_formatter)

#set chart source and copyright
plt.annotate('Source: UNHCR Refugee Data Finder', (0,0), (0, -25), xycoords='axes fraction', textcoords='offset points', va='top', color = '#666666', fontsize=9)
plt.annotate('©UNHCR, The UN Refugee Agency', (0,0), (0, -35), xycoords='axes fraction', textcoords='offset points', va='top', color = '#666666', fontsize=9)

#adjust chart margin and layout
fig.tight_layout()

# Save the figure to the specified path
fig.savefig('plot/column-basic.png')

#show chart
plt.show()
Column chart with data labels
# import libraries
import matplotlib.pyplot as plt
import pandas as pd
plt.style.use(['unhcrpyplotstyle','column'])

#load data set
df = pd.read_csv('https://raw.githubusercontent.com/GDS-ODSSS/unhcr-dataviz-platform/master/data/comparison/column.csv')

#compute data array for plotting
x = df['year']
y = df['displaced_number']

#plot the chart
fig, ax = plt.subplots()
bar_plot = ax.bar(x, y)

#set chart title
ax.set_title('Global IDP displacement | 2010 - 2020')

#set subtitle
plt.suptitle('Number of people in millions', x=0.025, y=0.88, ha='left')

#set tick based on x value
ax.set_xticks(x)

# set formatted data label
for x,y in zip(x,y):
    label = "{:.1f}".format(y*1e-6)
    plt.annotate(label,
                 (x,y),
                 textcoords="offset points",
                 xytext=(0,6),
                 ha='center')

#set chart source and copyright
plt.annotate('Source: UNHCR Refugee Data Finder', (0,0), (0, -25), xycoords='axes fraction', textcoords='offset points', va='top', color = '#666666', fontsize=9)
plt.annotate('©UNHCR, The UN Refugee Agency', (0,0), (0, -35), xycoords='axes fraction', textcoords='offset points', va='top', color = '#666666', fontsize=9)

#adjust chart margin and layout
fig.tight_layout()

# Save the figure to the specified path
fig.savefig('plot/column-labels.png')

#show chart
plt.show()
Grouped bar chart
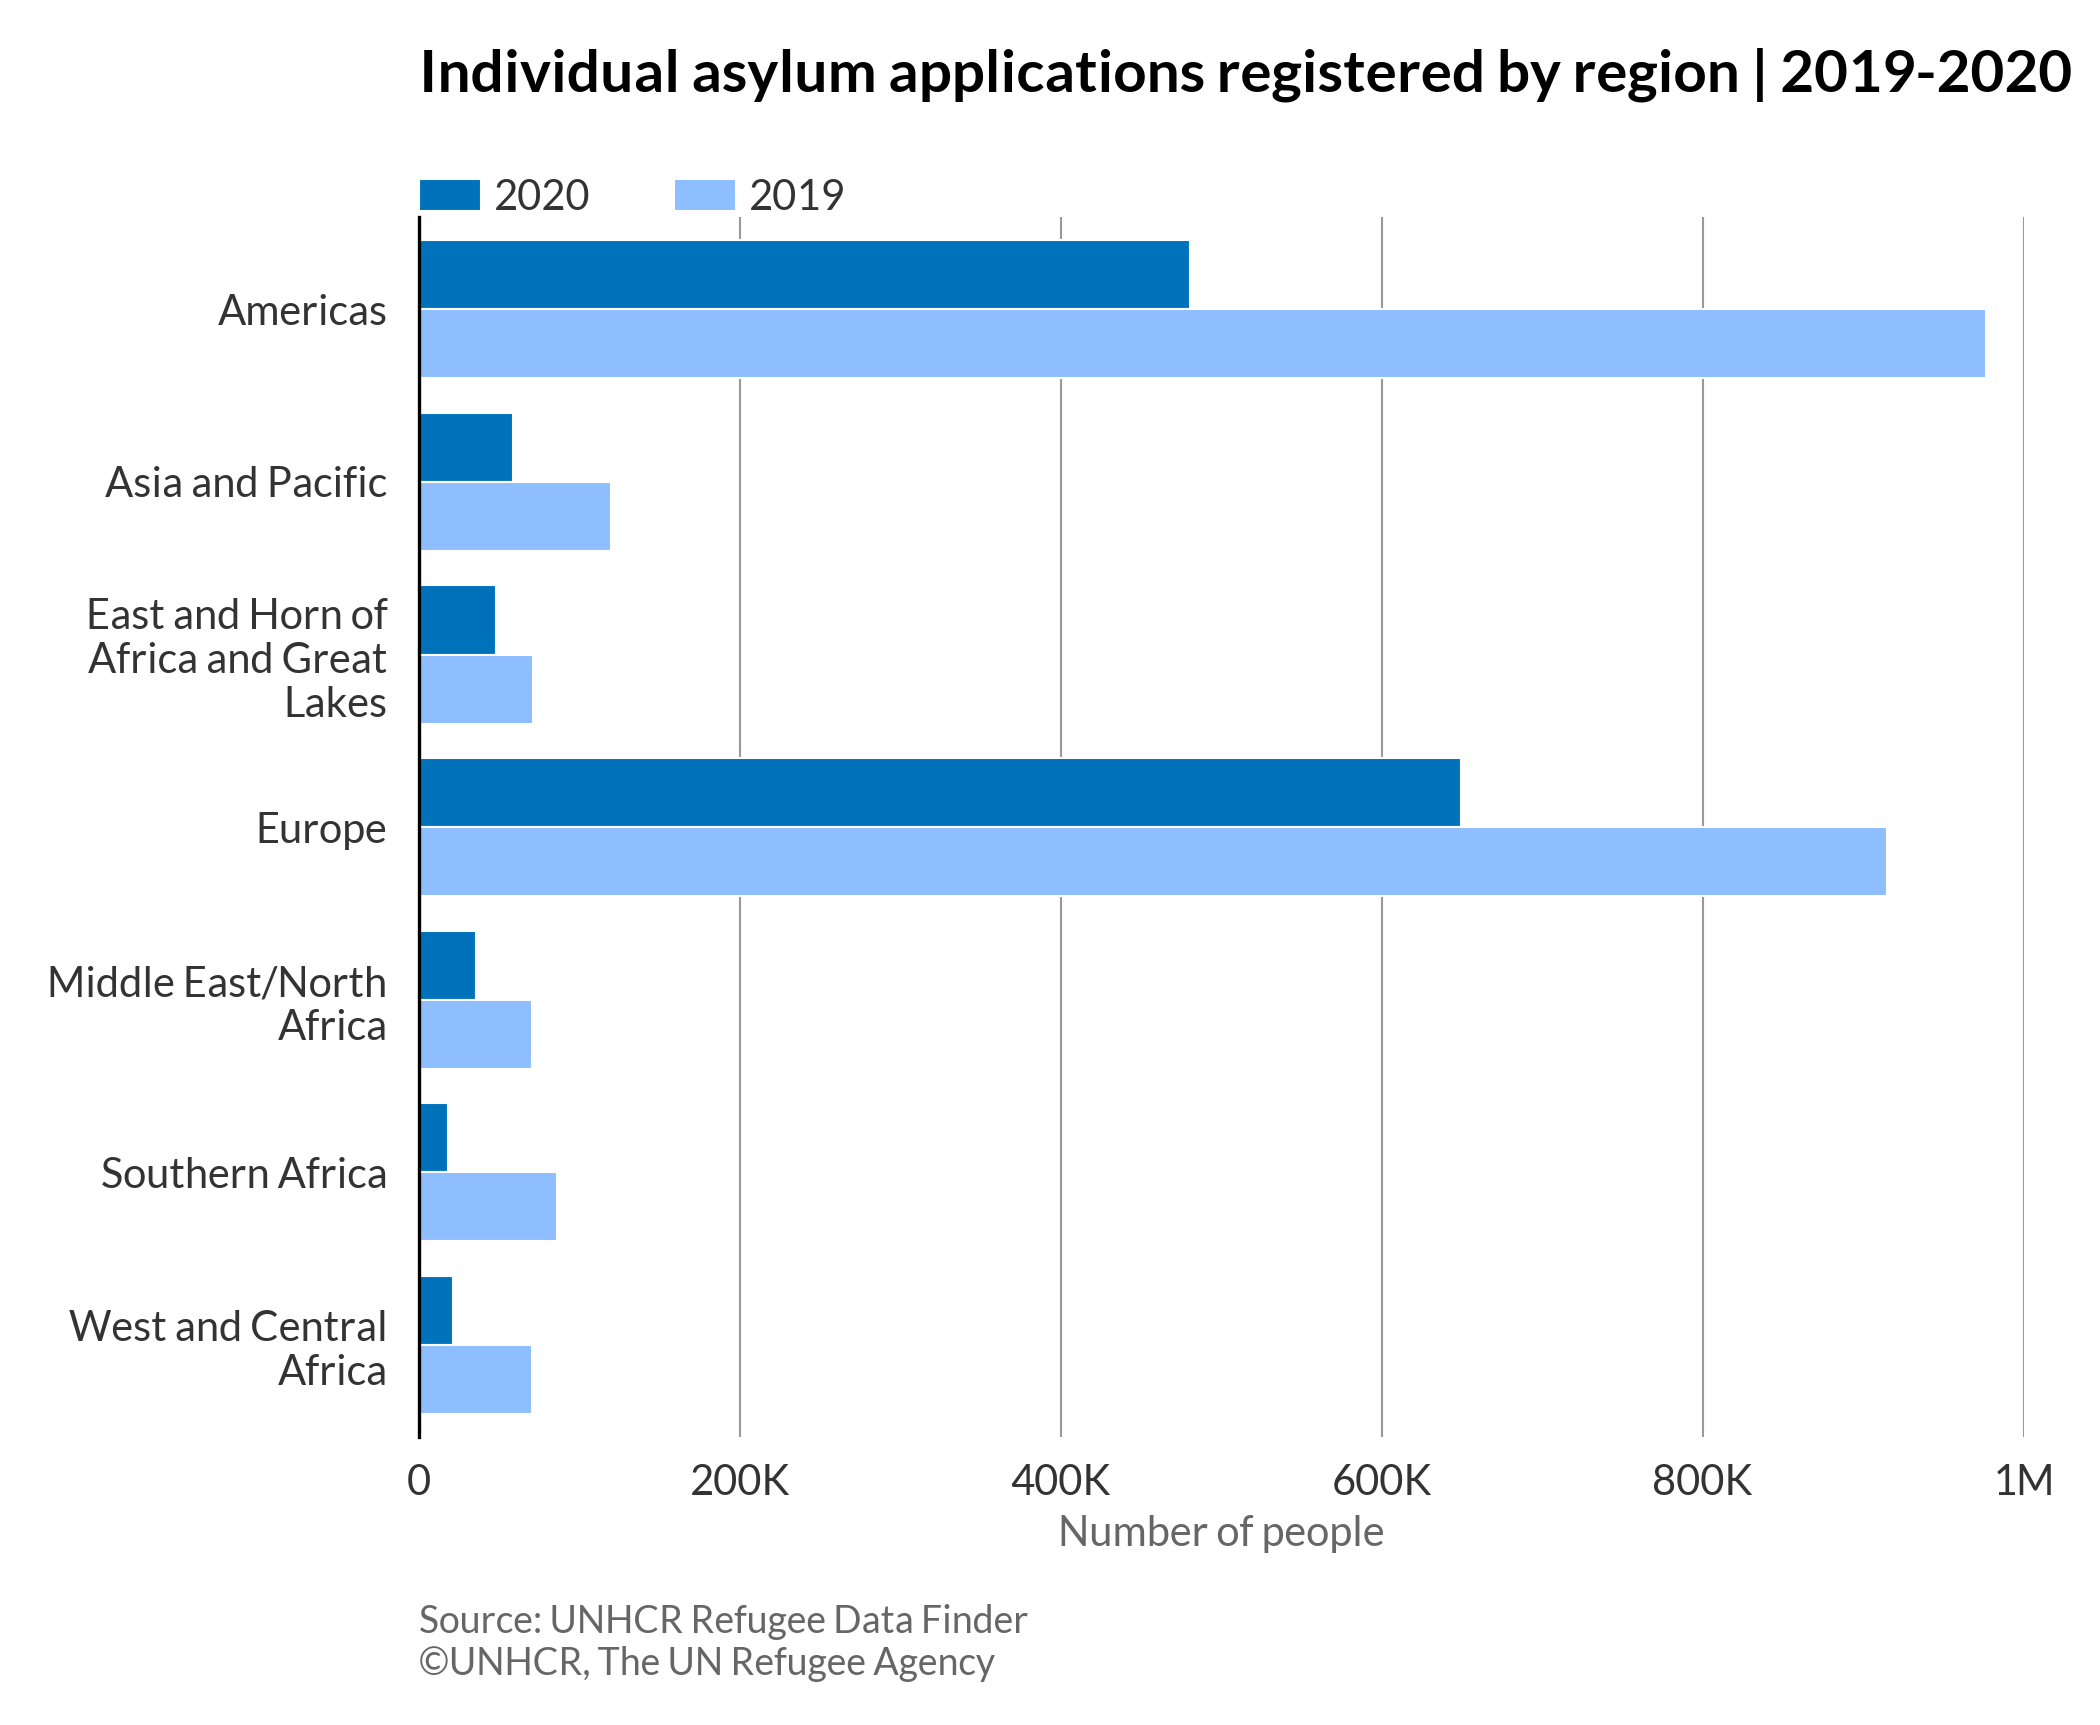
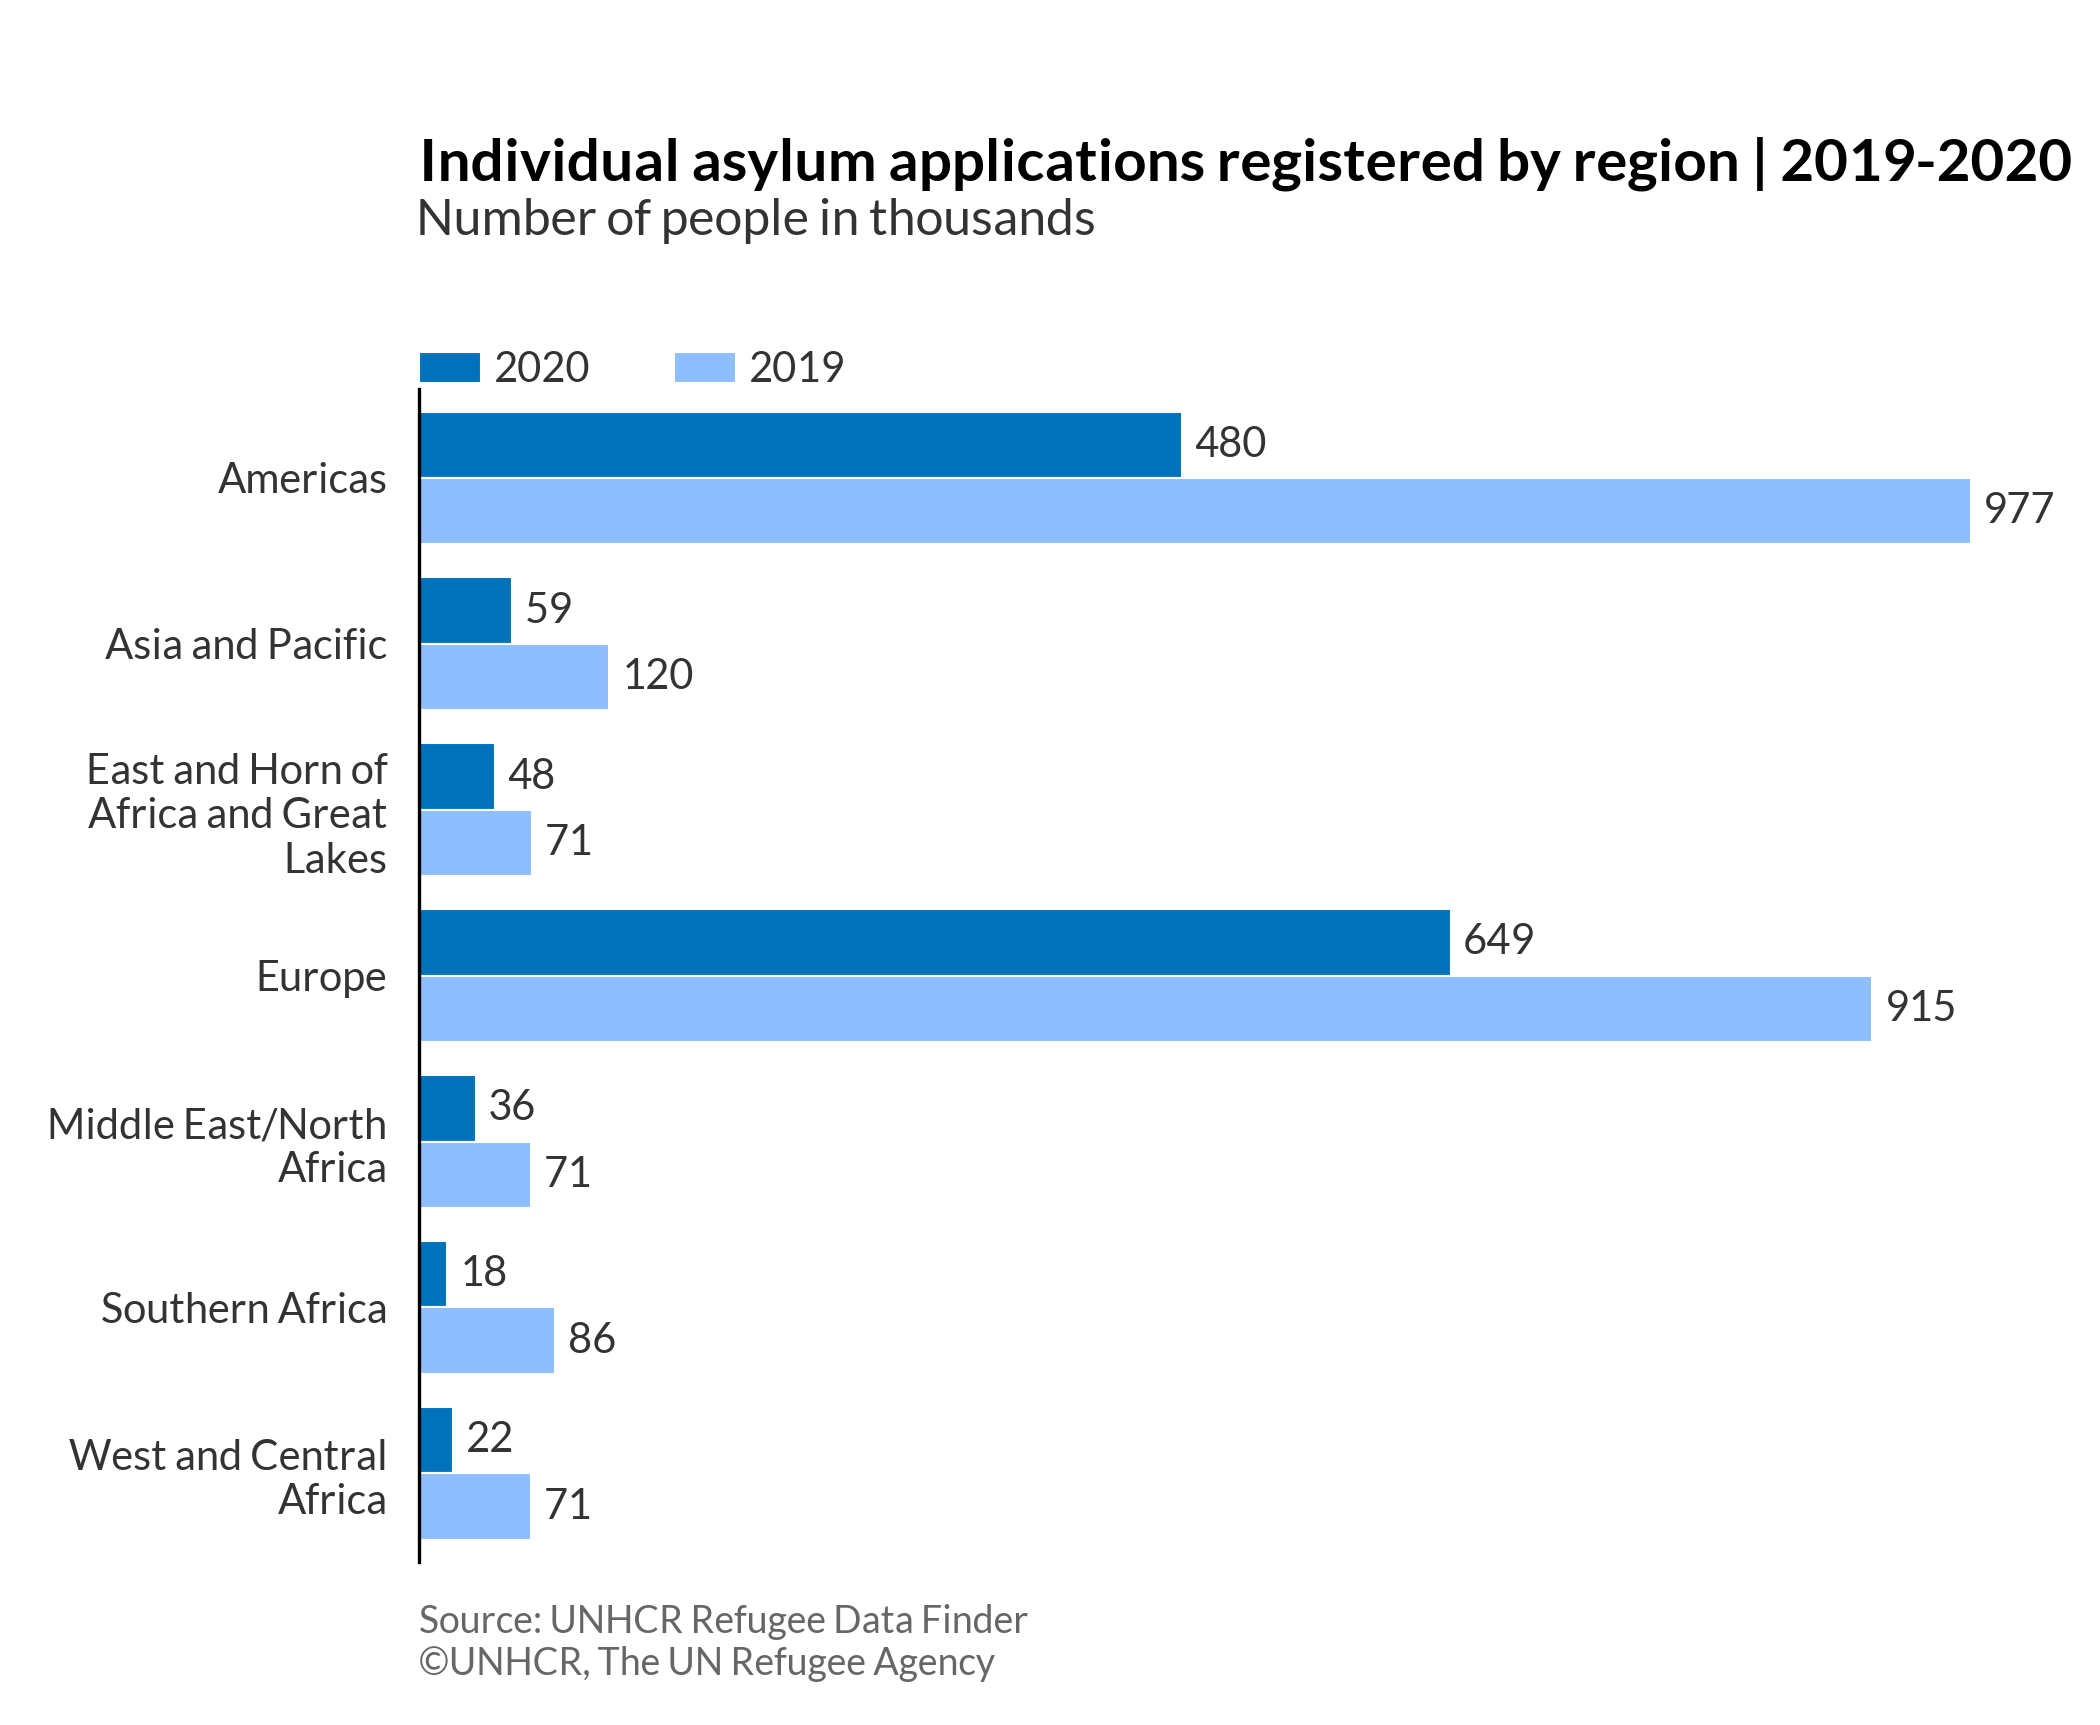
Grouped bar charts are a type of colour-coded bar chart that is used to represent and compare different categories of two or more groups.
More about: Grouped bar chart - Other tutorials: R Plotly Python D3
Basic grouped bar chart
# import libraries
import numpy as np
import matplotlib.pyplot as plt
import pandas as pd
from textwrap import wrap
plt.style.use(['unhcrpyplotstyle', 'bar'])

#load data set
df = pd.read_csv('https://raw.githubusercontent.com/GDS-ODSSS/unhcr-dataviz-platform/master/data/comparison/bar_grouped.csv')

#reshape df from long to wide
df = df.pivot(index='region', columns='year', values='asylum_application')
df = df.reset_index()

#sort value by descending order
df = df.sort_values(by=['region'], ascending=False)

#compute data array for plotting
labels = df['region']
category1 = df[2019]
category2 = df[2020]

#wrap long labels
labels = [ '\n'.join(wrap(l, 20)) for l in labels ]

#set x-axis ticks label location
x = np.arange(len(labels))

#set bar width
width = 0.4

#plot the chart
fig, ax = plt.subplots()
rects1 = ax.barh(x + width/2, category2, width, edgecolor='white', label=2020)
rects2 = ax.barh(x - width/2, category1, width, edgecolor='white', label=2019)

#set chart title
ax.set_title('Individual asylum applications registered by region | 2019-2020')

#set chart legend
ax.legend(loc=(0,1), ncol=2)

#set y-axis title
ax.set_xlabel('Number of people')

#set y-axis label
ax.tick_params(labelbottom=True)

#set x-axis label
ax.set_yticks(x, labels)

#set x-axis limit
xlimit = plt.xlim(0, 1000000)

#show grid below the bars
ax.grid(axis='x')

#format x-axis tick labels
def number_formatter(x, pos):
    if x >= 1e6:
        s = '{:1.0f}M'.format(x*1e-6)
    elif x < 1e6 and x >= 1e3:
        s = '{:1.0f}K'.format(x*1e-3)
    else:
        s = '{:1.0f}'.format(x)
    return s
ax.xaxis.set_major_formatter(number_formatter)

#set chart source and copyright
plt.annotate('Source: UNHCR Refugee Data Finder', (0,0), (0, -40), xycoords='axes fraction', textcoords='offset points', va='top', color = '#666666', fontsize=9)
plt.annotate('©UNHCR, The UN Refugee Agency', (0,0), (0, -50), xycoords='axes fraction', textcoords='offset points', va='top', color = '#666666', fontsize=9)

#adjust chart margin and layout
fig.tight_layout()

# Save the figure to the specified path
fig.savefig('plot/grouped-bar-basic.png')

#show chart
plt.show()
Grouped bar chart with data label
# import libraries
import numpy as np
import matplotlib.pyplot as plt
import pandas as pd
from textwrap import wrap
plt.style.use(['unhcrpyplotstyle', 'bar'])

#load data set
df = pd.read_csv('https://raw.githubusercontent.com/GDS-ODSSS/unhcr-dataviz-platform/master/data/comparison/bar_grouped.csv')

#reshape df from long to wide
df = df.pivot(index='region', columns='year', values='asylum_application')
df = df.reset_index()

#sort value in descending order
df = df.sort_values(by=['region'], ascending=False)

#prepare data array for plotting
labels = df['region']
category1 = df[2019]
category2 = df[2020]

#wrap long labels
labels = [ '\n'.join(wrap(l, 20)) for l in labels ]

#set x-axis ticks label location
x = np.arange(len(labels))

#set bar width
width = 0.4

#plot the chart
fig, ax = plt.subplots()

rects1 = ax.barh(x + width/2, category2, width, edgecolor='white', label=2020)
rects2 = ax.barh(x - width/2, category1, width, edgecolor='white', label=2019)

#set chart title
ax.set_title('Individual asylum applications registered by region | 2019-2020', pad=50)

#set subtitle
plt.suptitle('Number of people in thousands', x=0.36, y=0.885)

#set chart legend
ax.legend(loc=(0,1), ncol=2)

#set formatted data label
ax.bar_label(rects1, labels=[f'{x*1e-3:,.0f}' for x in rects1.datavalues], padding=3)
ax.bar_label(rects2, labels=[f'{x*1e-3:,.0f}' for x in rects2.datavalues], padding=3)

#set x-axis tick and label
ax.set_yticks(x, labels)

#set chart source and copyright
plt.annotate('Source: UNHCR Refugee Data Finder', (0,0), (0, -10), xycoords='axes fraction', textcoords='offset points', va='top', color = '#666666', fontsize=9)
plt.annotate('©UNHCR, The UN Refugee Agency', (0,0), (0, -20), xycoords='axes fraction', textcoords='offset points', va='top', color = '#666666', fontsize=9)

#adjust chart margin and layout
fig.tight_layout()

# Save the figure to the specified path
fig.savefig('plot/grouped-bar-labels.png')

#show chart
plt.show()
Grouped column chart
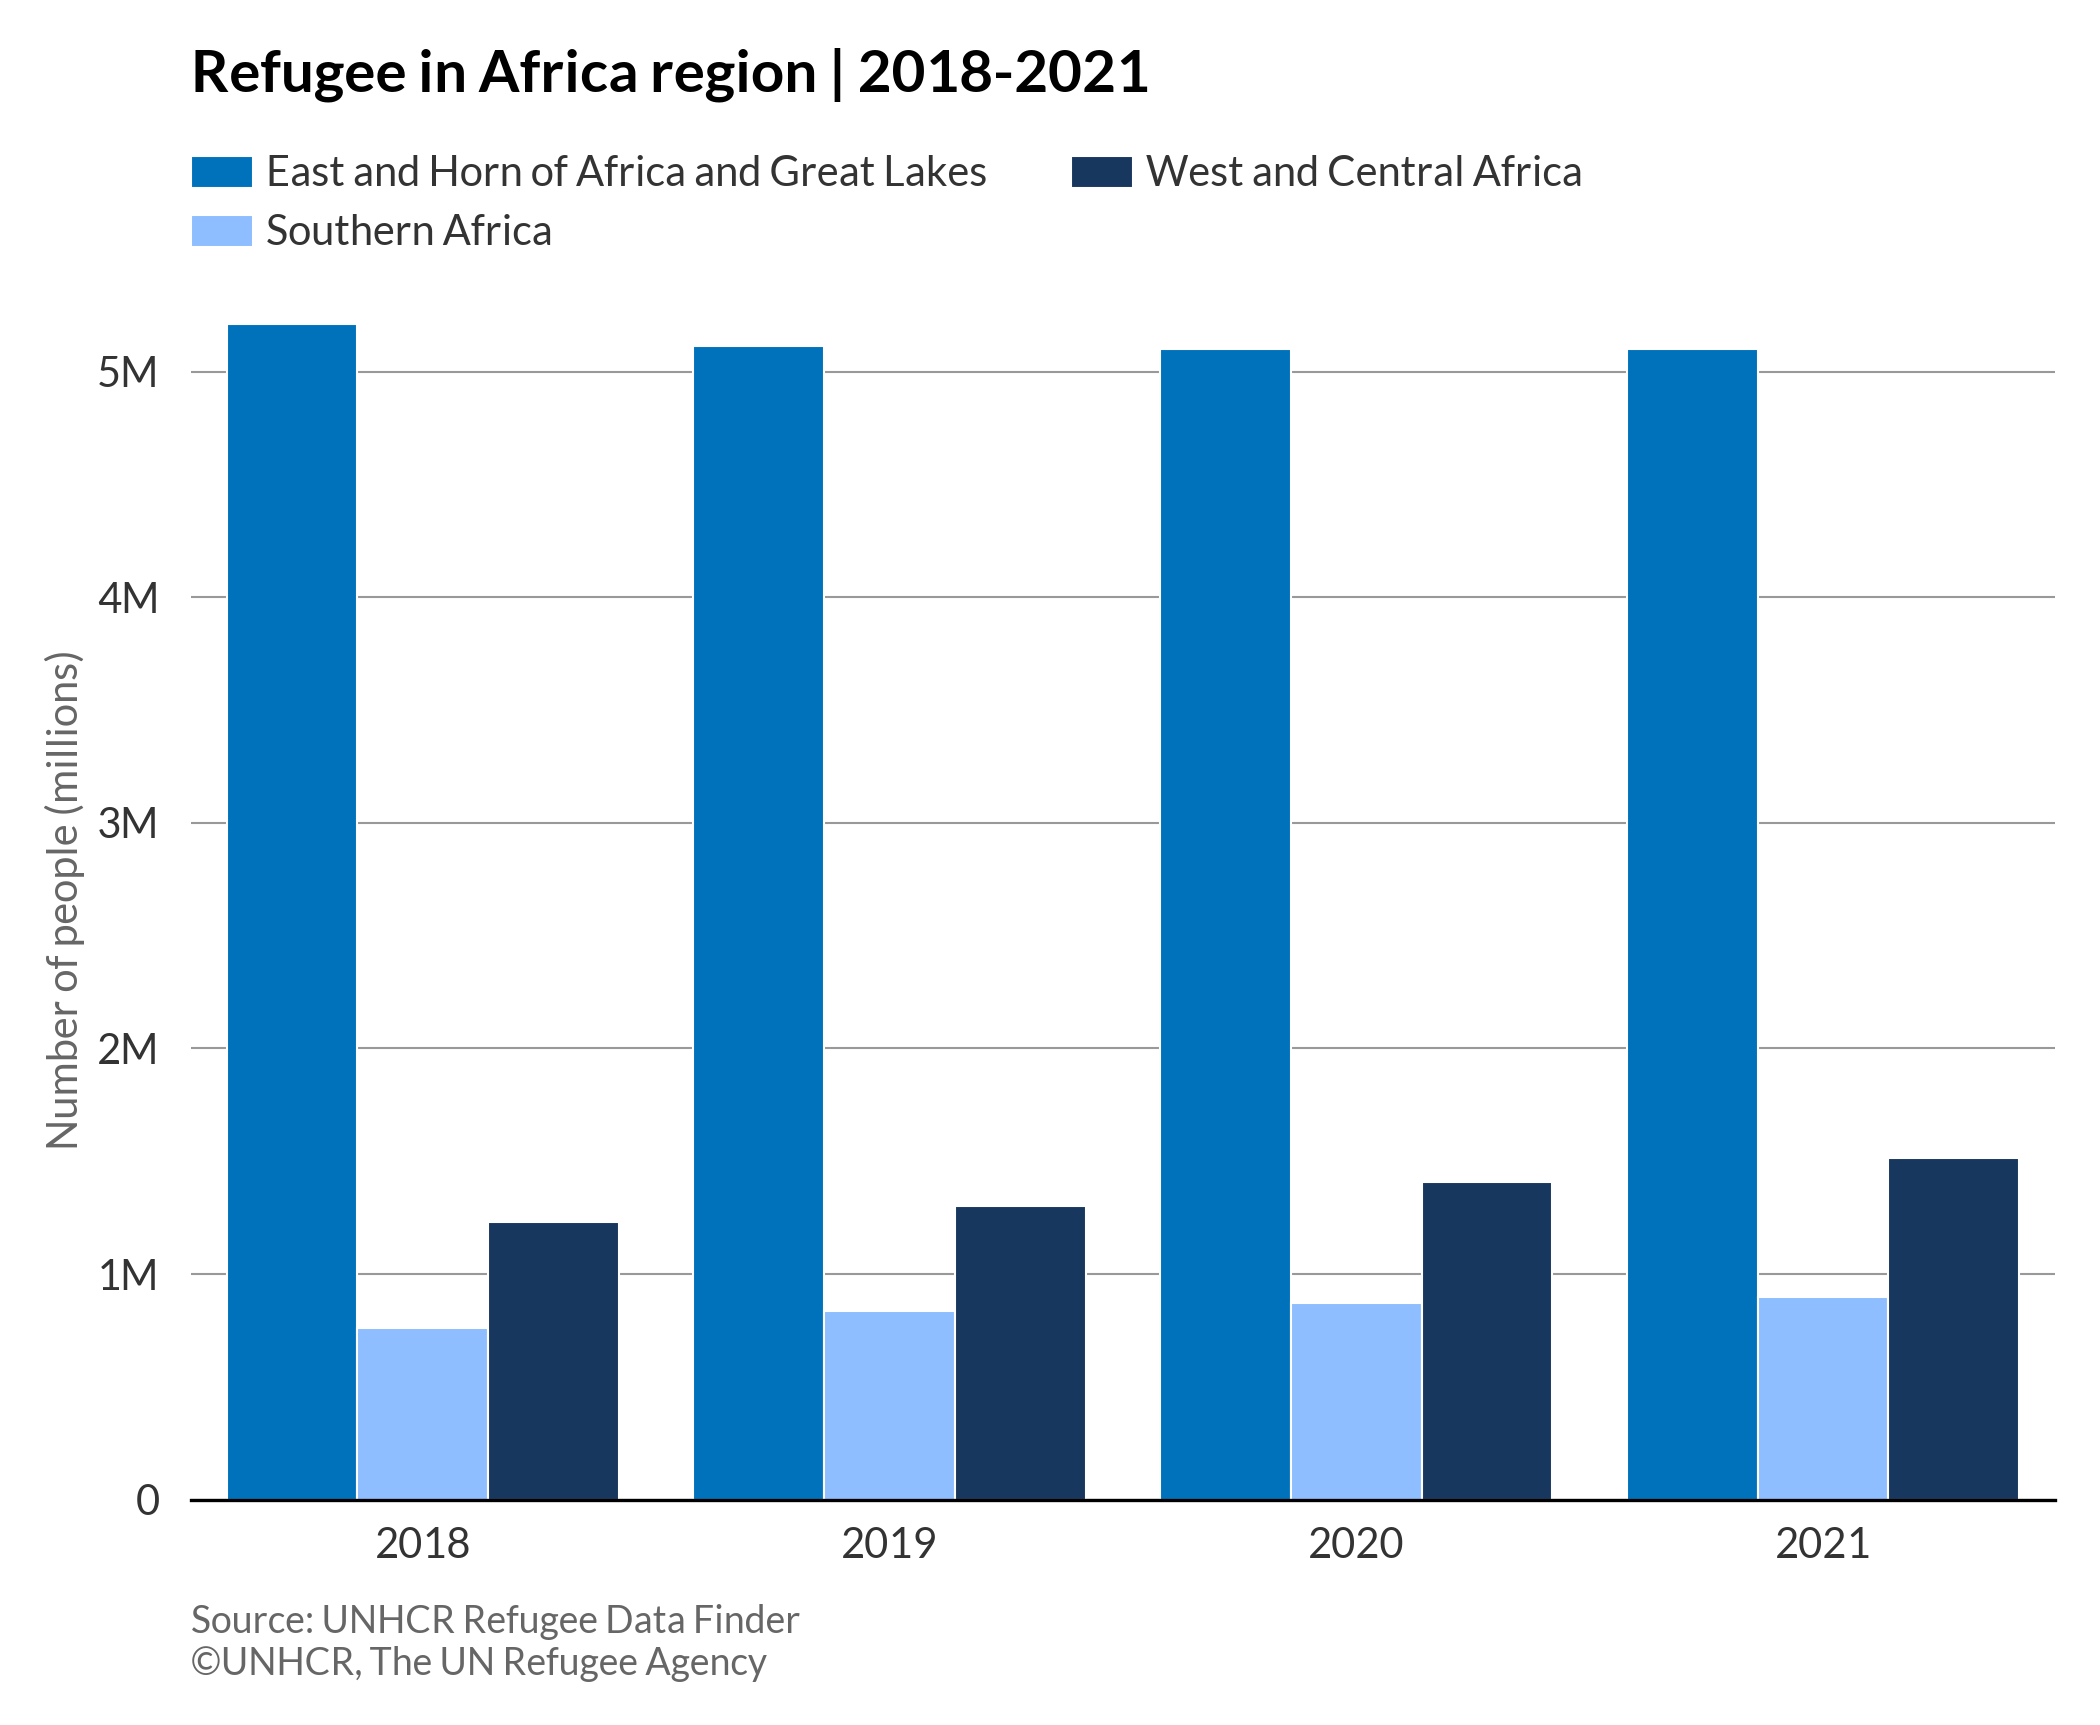
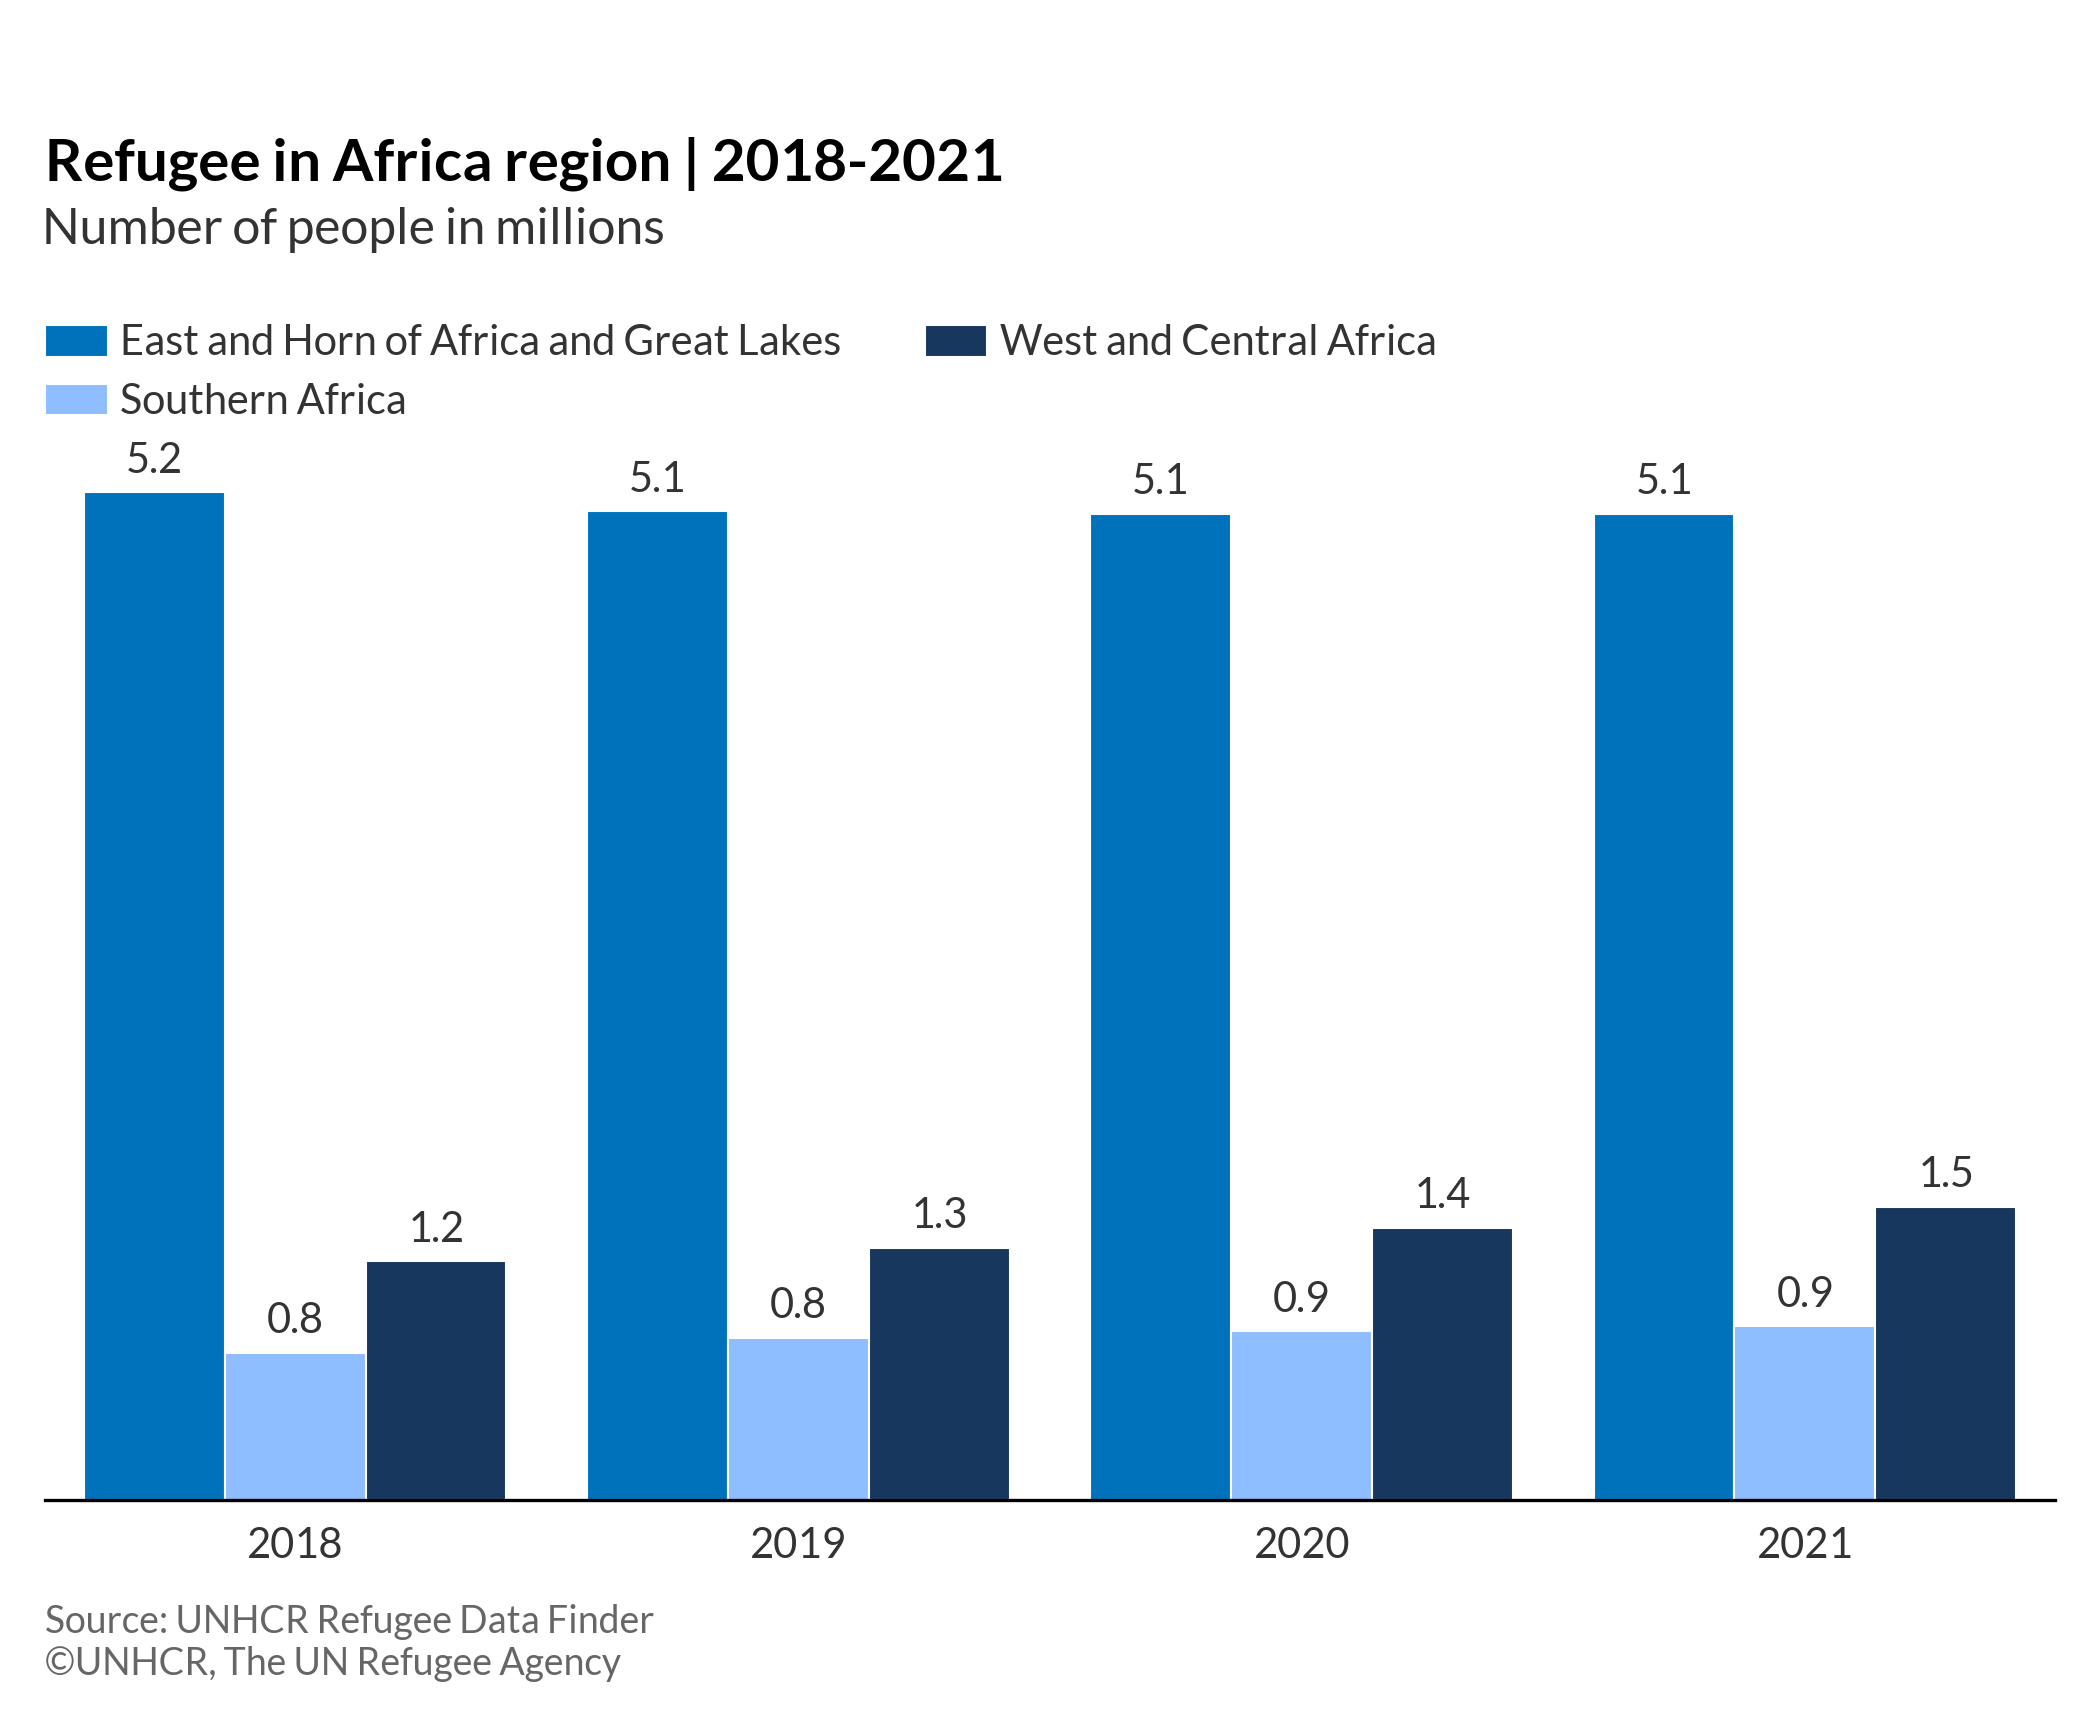
Grouped column charts are a type of colour-coded column chart used to represent and compare different categories of two or more groups.
More about: Grouped column chart - Other tutorials: R Plotly Python D3
Basic grouped column chart
# import libraries
import numpy as np
import matplotlib.pyplot as plt
import pandas as pd
plt.style.use(['unhcrpyplotstyle','column'])

#load data set
df = pd.read_csv('https://raw.githubusercontent.com/GDS-ODSSS/unhcr-dataviz-platform/master/data/comparison/column_grouped.csv')

#reshape df from long to wide
df = df.pivot(index='year', columns='main_office', values='refugee_number')
df = df.reset_index()

#prepare data array for plotting
labels = df['year']
category1 = df['East and Horn of Africa and Great Lakes']
category2 = df['Southern Africa']
category3 = df['West and Central Africa']

#set x-axis ticks label location
x = np.arange(len(labels))

#set bar width
width = 0.28

#plot the chart
fig, ax = plt.subplots()
rects1 = ax.bar(x - width, category1, width, edgecolor='white', label='East and Horn of Africa and Great Lakes')
rects2 = ax.bar(x, category2, width, edgecolor='white', label='Southern Africa')
rects3 = ax.bar(x + width, category3, width, edgecolor='white', label='West and Central Africa')

#set chart title
ax.set_title('Refugee in Africa region | 2018-2021', pad=50)

#set chart legend
ax.legend(loc=(0,1.04), ncol=2)

#set y-axis title
ax.set_ylabel('Number of people (millions)')

#set y-axis label
ax.tick_params(labelleft=True)

#set x-axis tick and label
ax.set_xticks(x, labels)

#show grid below the bars
ax.grid(axis='y')

#format y-axis tick labels
def number_formatter(x, pos):
    if x >= 1e6:
        s = '{:1.0f}M'.format(x*1e-6)
    elif x < 1e6 and x >= 1e3:
        s = '{:1.0f}K'.format(x*1e-3)
    else:
        s = '{:1.0f}'.format(x)
    return s
ax.yaxis.set_major_formatter(number_formatter)

#set chart source and copyright
plt.annotate('Source: UNHCR Refugee Data Finder', (0,0), (0, -25), xycoords='axes fraction', textcoords='offset points', va='top', color = '#666666', fontsize=9)
plt.annotate('©UNHCR, The UN Refugee Agency', (0,0), (0, -35), xycoords='axes fraction', textcoords='offset points', va='top', color = '#666666', fontsize=9)

#adjust chart margin and layout
fig.tight_layout()

# Save the figure to the specified path
fig.savefig('plot/grouped-column-basic.png')

#show chart
plt.show()
Grouped column chart with data label
# import libraries
import numpy as np
import matplotlib.pyplot as plt
import pandas as pd
plt.style.use(['unhcrpyplotstyle','column'])

#load data set
df = pd.read_csv('https://raw.githubusercontent.com/GDS-ODSSS/unhcr-dataviz-platform/master/data/comparison/column_grouped.csv')

#reshape df from long to wide
df = df.pivot(index='year', columns='main_office', values='refugee_number')
df = df.reset_index()

#compute data array for plotting
labels = df['year']
category1 = df['East and Horn of Africa and Great Lakes']
category2 = df['Southern Africa']
category3 = df['West and Central Africa']

#set x-axis ticks label location
x = np.arange(len(labels))

#set bar width
width = 0.28

#plot the chart
fig, ax = plt.subplots()
rects1 = ax.bar(x - width, category1, width, edgecolor='white', label='East and Horn of Africa and Great Lakes')
rects2 = ax.bar(x, category2, width, edgecolor='white', label='Southern Africa')
rects3 = ax.bar(x + width, category3, width, edgecolor='white', label='West and Central Africa')

#set chart title
ax.set_title('Refugee in Africa region | 2018-2021', pad=70)

#set subtitle
plt.suptitle('Number of people in millions', x=0.02, y=0.88, ha='left', va='top')

#set x-axis tick and label
ax.set_xticks(x, labels)

#set chart legend
ax.legend(loc=(0,1.05), ncol=2)

# set formatted data label
ax.bar_label(rects1, labels=[f'{x*1e-6:,.1f}' for x in rects1.datavalues], padding=3)
ax.bar_label(rects2, labels=[f'{x*1e-6:,.1f}' for x in rects2.datavalues], padding=3)
ax.bar_label(rects3, labels=[f'{x*1e-6:,.1f}' for x in rects3.datavalues], padding=3)

#set chart source and copyright
plt.annotate('Source: UNHCR Refugee Data Finder', (0,0), (0, -25), xycoords='axes fraction', textcoords='offset points', va='top', color = '#666666', fontsize=9)
plt.annotate('©UNHCR, The UN Refugee Agency', (0,0), (0, -35), xycoords='axes fraction', textcoords='offset points', va='top', color = '#666666', fontsize=9)

#adjust chart margin and layout
fig.tight_layout()

# Save the figure to the specified path
fig.savefig('plot/grouped-column-labels.png')

#show chart
plt.show()
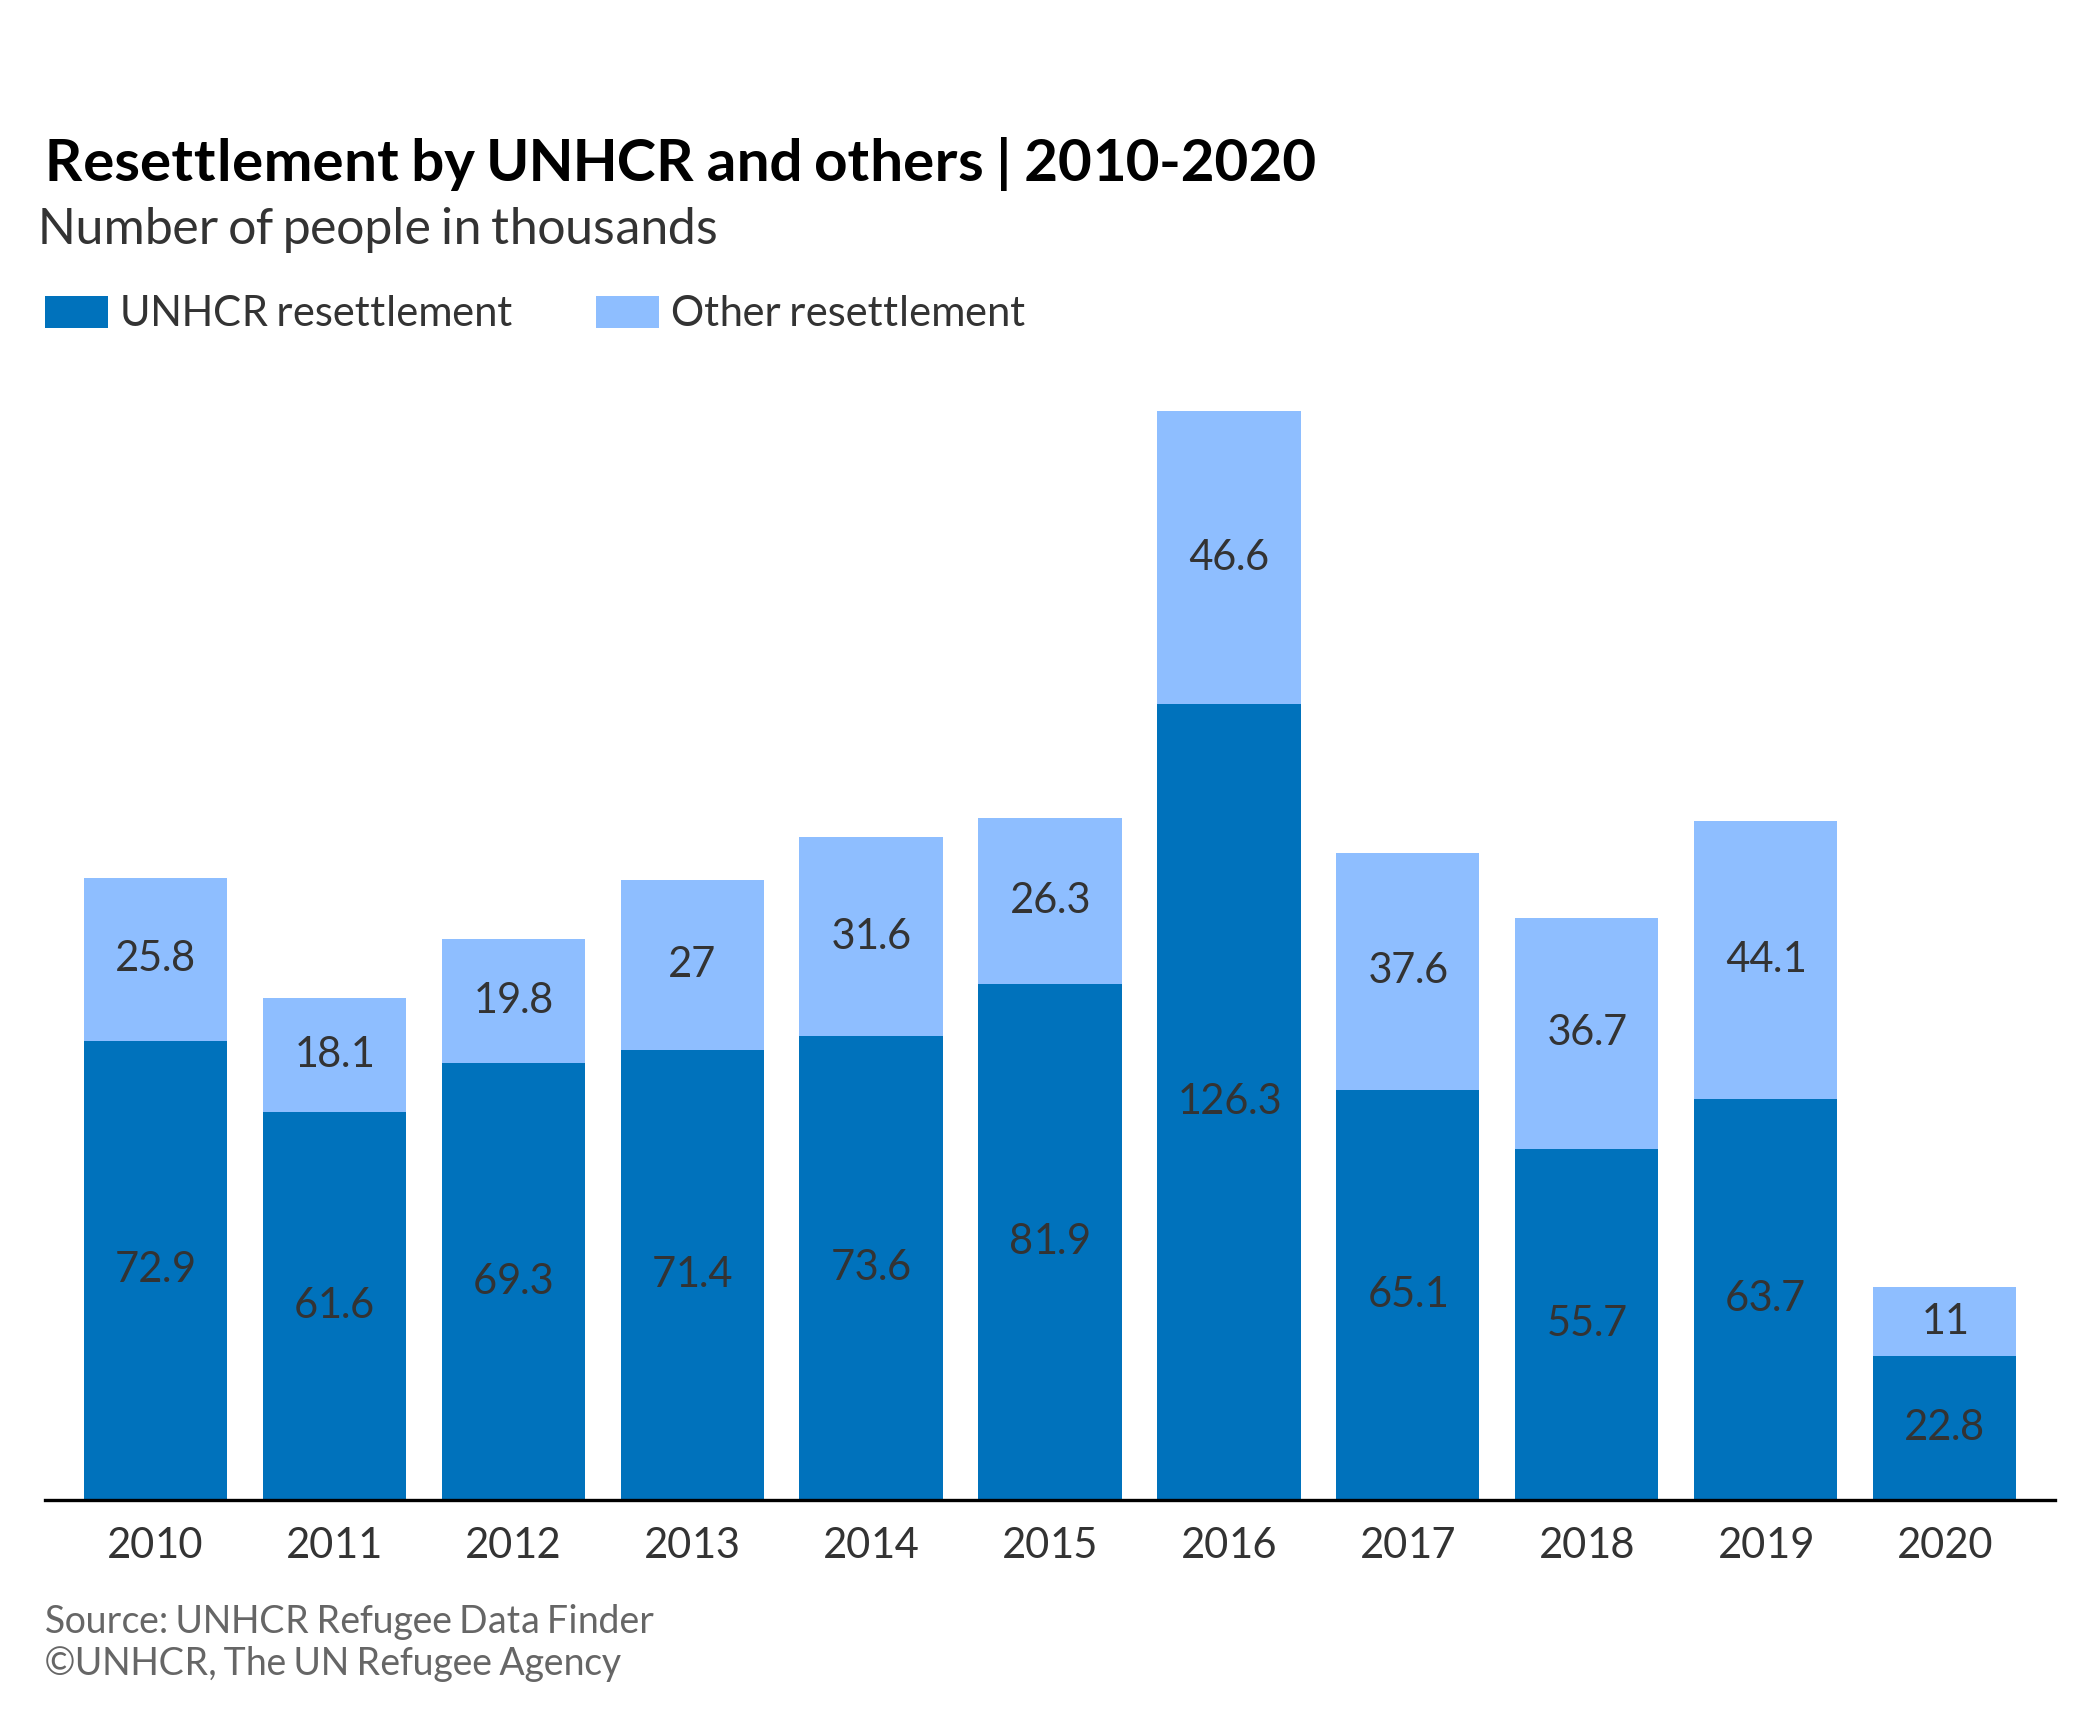
Stacked bar chart
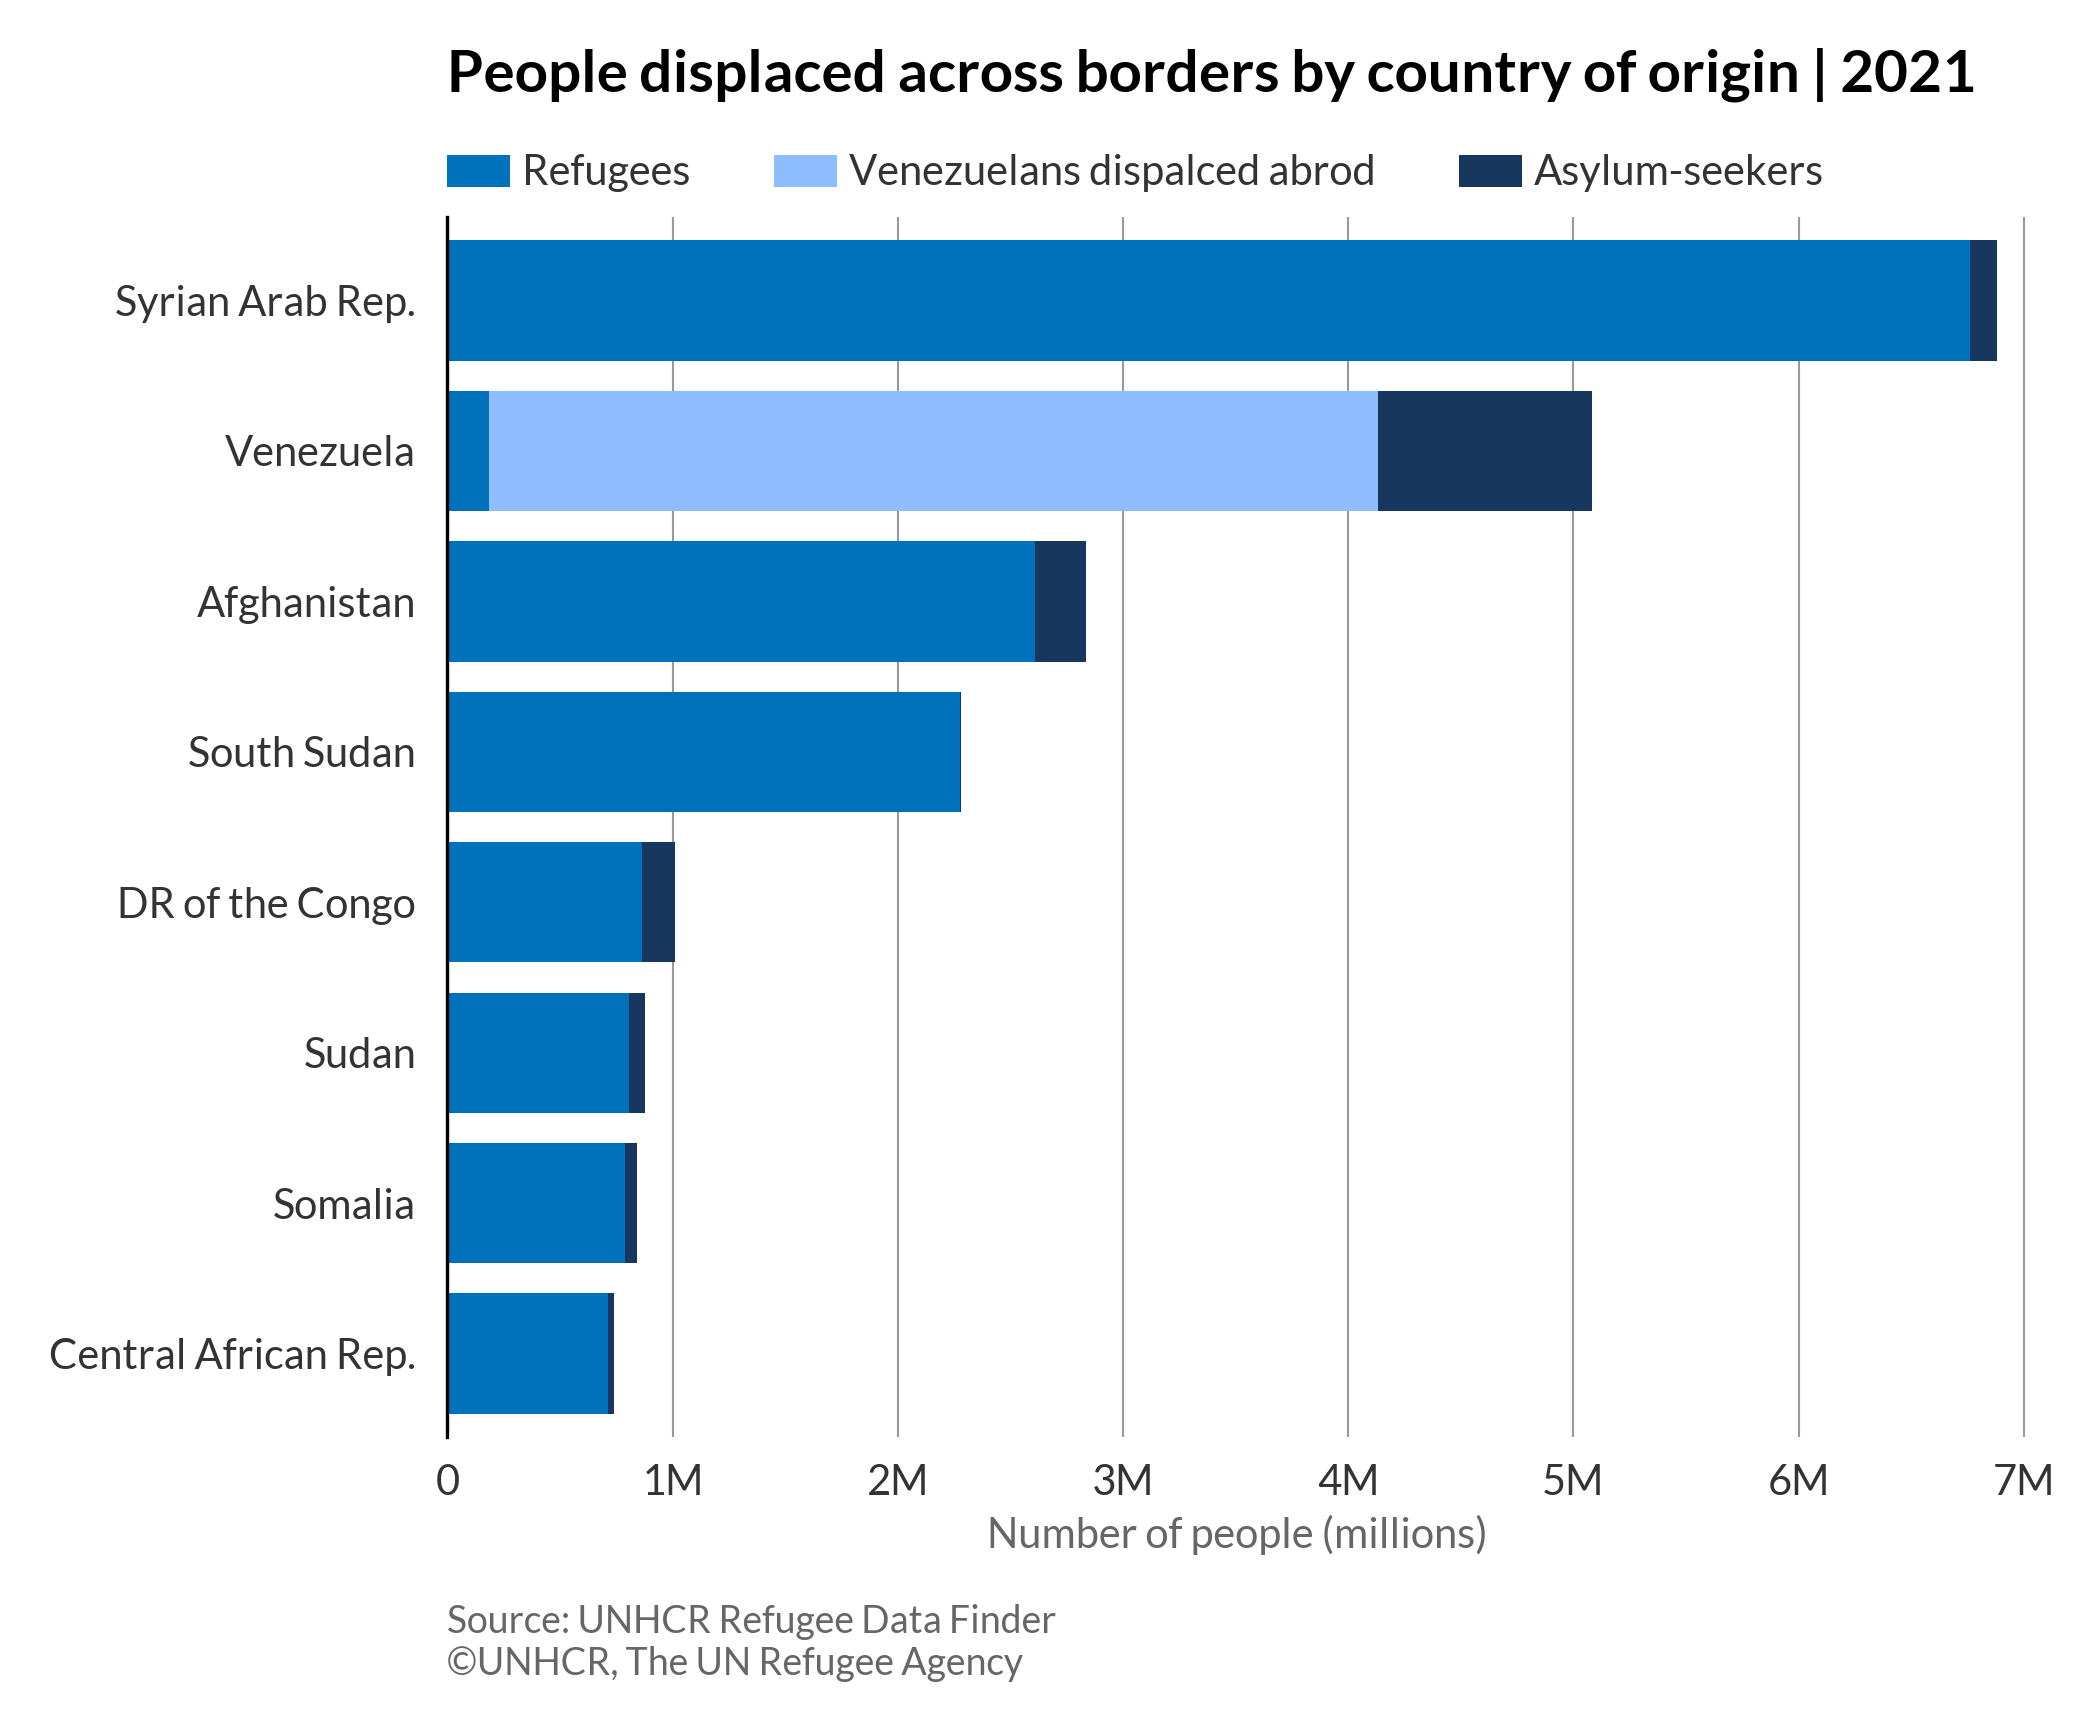
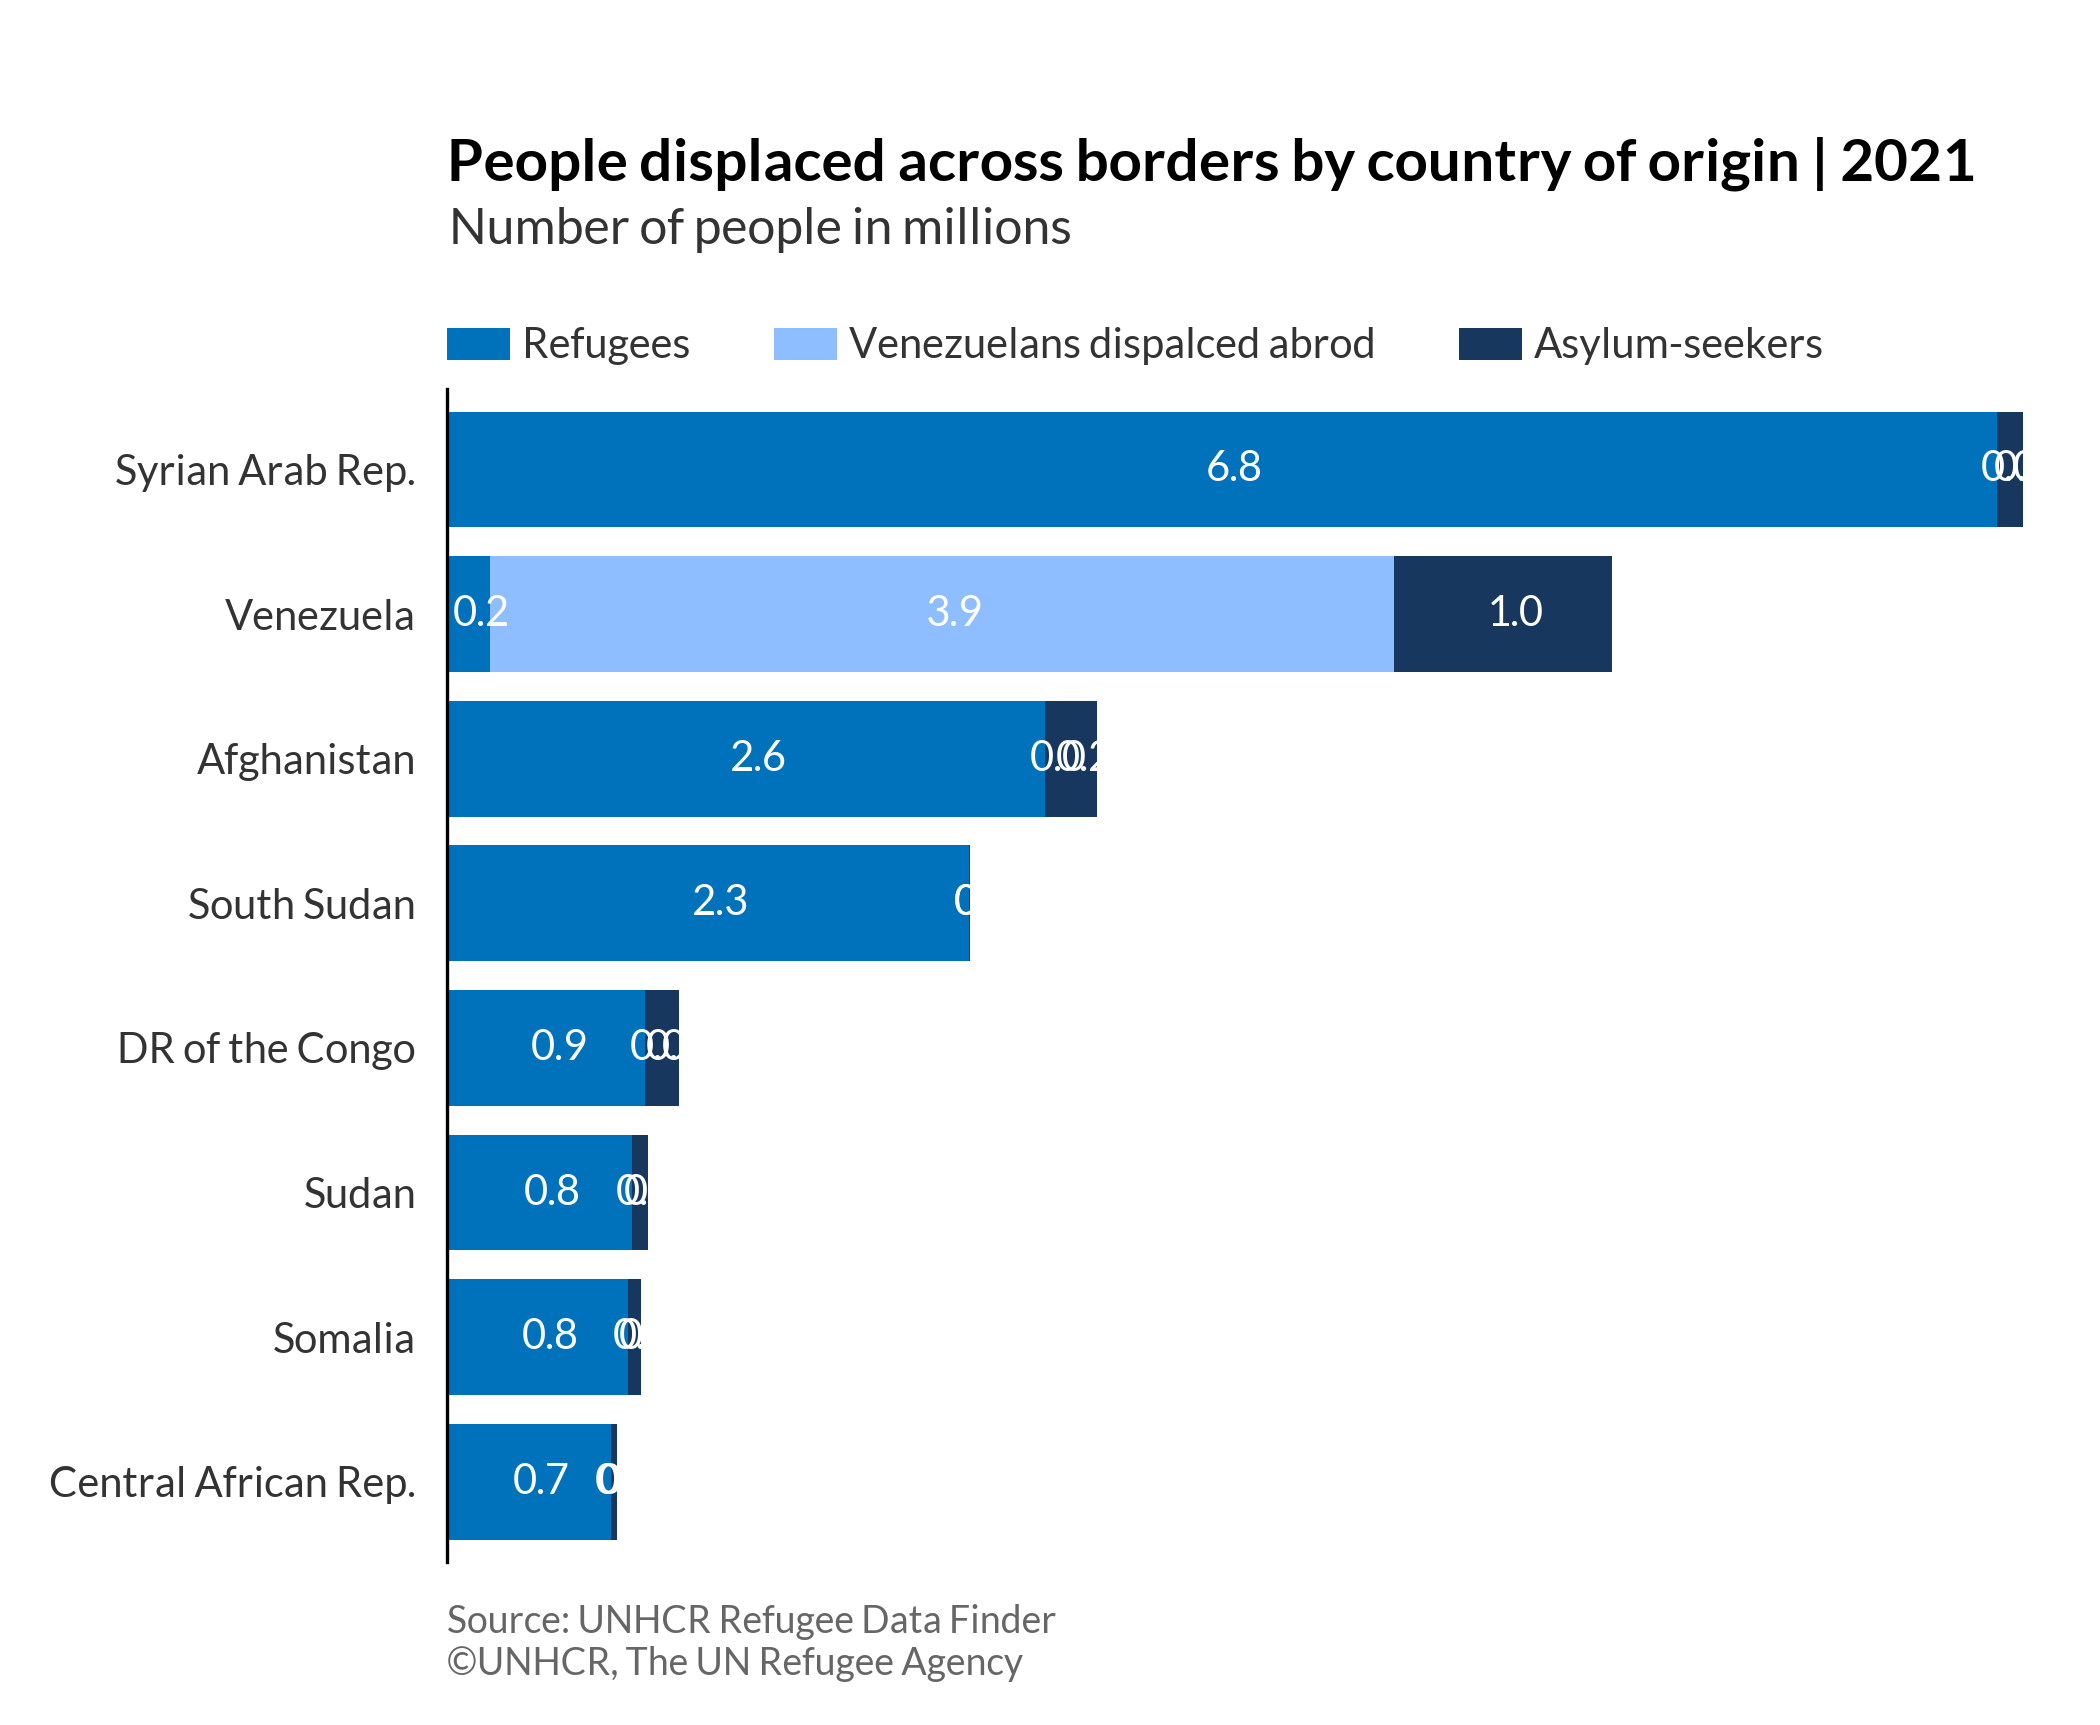
Stacked bar charts stack horizontal bars that represent different groups one after another. The length of the stacked bar shows the combined value of the groups. They show the cumulative values of data items and compare parts to the whole.
More about: Stacked bar chart - Other tutorials: R Plotly Python D3
Basic stacked bar chart
# import libraries
import numpy as np
import matplotlib.pyplot as plt
import pandas as pd
from textwrap import wrap
plt.style.use(['unhcrpyplotstyle','bar'])

#load data set
df = pd.read_csv('https://raw.githubusercontent.com/GDS-ODSSS/unhcr-dataviz-platform/master/data/comparison/bar_stacked.csv')

#reshape df from long to wide
df = df.pivot(index='country_origin', columns='population_type', values='population_number')
df = df.reset_index()

#sort by total descending order
df['Total'] = df.sum(numeric_only=True, axis=1)
df = df.sort_values("Total", ascending=True)
df= df.fillna(0)

#prepare data array for plotting
x = df['country_origin']

y1 = df['REF']
y2 = df['VDA']
y3 = df['ASY']
b_y3 = np.add(y1, y2)

#wrap long labels
x = [ '\n'.join(wrap(l, 20)) for l in x ]

#plot the chart
fig, ax = plt.subplots()
rect1=ax.barh(x, y1, label='Refugees')
rect2=ax.barh(x, y2, left=y1, label='Venezuelans dispalced abrod')
rect3=ax.barh(x, y3, left=b_y3, label='Asylum-seekers')

#set chart title
ax.set_title('People displaced across borders by country of origin | 2021')

#set chart legend
ax.legend(loc=(0,1.02), ncol=3)

#set y-axis title
ax.set_xlabel('Number of people (millions)')

#set y-axis label
ax.tick_params(labelbottom=True)

#show grid below the bars
ax.grid(axis='x')

#format x-axis tick labels
def number_formatter(x, pos):
    if x >= 1e6:
        s = '{:1.0f}M'.format(x*1e-6)
    elif x < 1e6 and x >= 1e3:
        s = '{:1.0f}K'.format(x*1e-3)
    else:
        s = '{:1.0f}'.format(x)
    return s
ax.xaxis.set_major_formatter(number_formatter)

#set chart source and copyright
plt.annotate('Source: UNHCR Refugee Data Finder', (0,0), (0, -40), xycoords='axes fraction', textcoords='offset points', va='top', color = '#666666', fontsize=9)
plt.annotate('©UNHCR, The UN Refugee Agency', (0,0), (0, -50), xycoords='axes fraction', textcoords='offset points', va='top', color = '#666666', fontsize=9)

#adjust chart margin and layout
fig.tight_layout()

# Save the figure to the specified path
fig.savefig('plot/stacked-bar-basic.png')

#show chart
plt.show()
Stacked bar chart with data label
# import libraries
import numpy as np
import matplotlib.pyplot as plt
import pandas as pd
from textwrap import wrap
plt.style.use(['unhcrpyplotstyle','bar'])

#load data set
df = pd.read_csv('https://raw.githubusercontent.com/GDS-ODSSS/unhcr-dataviz-platform/master/data/comparison/bar_stacked.csv')

#reshape df from long to wide
df = df.pivot(index='country_origin', columns='population_type', values='population_number')
df = df.reset_index()

#sort by total descending order
df['Total'] = df.sum(numeric_only=True, axis=1)
df = df.sort_values("Total", ascending=True)
df= df.fillna(0)

#compute data array for plotting

x = df['country_origin']
y1 = df['REF']
y2 = df['VDA']
y3 = df['ASY']
b_y3 = np.add(y1, y2)

#wrap long labels
x = [ '\n'.join(wrap(l, 20)) for l in x ]

#plot the chart
fig, ax = plt.subplots()
rect2=ax.barh(x, y1,label='Refugees')
rect1=ax.barh(x, y2, left=y1, label='Venezuelans dispalced abrod')
rect3=ax.barh(x, y3, left=b_y3, label='Asylum-seekers')

#set chart title
ax.set_title('People displaced across borders by country of origin | 2021', pad=50)

#set subtitle
plt.suptitle('Number of people in millions', x=0.362, y=0.88)

#set chart legend
ax.legend(loc=(0,1.02), ncol=3)

# set formatted data label
ax.bar_label(rect1, labels=[f'{x*1e-6:,.1f}' for x in rect1.datavalues], label_type='center', padding=3,color='#ffffff')
ax.bar_label(rect2, labels=[f'{x*1e-6:,.1f}' for x in rect2.datavalues], label_type='center', padding=3,color='#ffffff')
ax.bar_label(rect3, labels=[f'{x*1e-6:,.1f}' for x in rect3.datavalues], label_type='center', padding=3,color='#ffffff')

#set chart source and copyright
plt.annotate('Source: UNHCR Refugee Data Finder', (0,0), (0, -10), xycoords='axes fraction', textcoords='offset points', va='top', color = '#666666', fontsize=9)
plt.annotate('©UNHCR, The UN Refugee Agency', (0,0), (0, -20), xycoords='axes fraction', textcoords='offset points', va='top', color = '#666666', fontsize=9)

#adjust chart margin and layout
fig.tight_layout()

# Save the figure to the specified path
fig.savefig('plot/stacked-bar-labels.png')

#show chart
plt.show()
Stacked column chart
The stacked column chart stacks vertical bars that represent different groups on top of each other. The height of the stacked bar shows the combined value of the groups. They show the cumulative values of a data item and compare parts to the whole.
More about: Stacked column chart - Other tutorials: R Plotly Python D3
Basic stacked column chart
# import libraries
import matplotlib.pyplot as plt
import pandas as pd
plt.style.use(['unhcrpyplotstyle', 'column'])

#load data set
df = pd.read_csv('https://raw.githubusercontent.com/GDS-ODSSS/unhcr-dataviz-platform/master/data/comparison/column_stacked.csv')

#reshape df from long to wide
df = df.pivot(index='year', columns='rst_type', values='rst_in_thousand')
df = df.reset_index()

#compute data array for plotting
x = df['year']
y1 = df['UNHCR resettlement']
y2 = df['Other resettlement']

#plot the chart
fig, ax = plt.subplots()
rect1=ax.bar(x, y1, label='UNHCR resettlement')
rect2=ax.bar(x, y2, bottom=y1, label='Other resettlement')

#set chart title
ax.set_title('Resettlement by UNHCR and others | 2010-2020', pad=50)

#set chart legend
ax.legend(loc=(0,1.05), ncol=2)

#set y-axis title
ax.set_ylabel('Number of people (thousands)')

#set tick label
ax.tick_params(labelleft=True)

#set x-axis tick and label
ax.set_xticks(x)

#set x-axis limit
ylimit = plt.ylim(0, 180)

#show grid below the bars
ax.grid(axis='y')

#set chart source and copyright
plt.annotate('Source: UNHCR Refugee Data Finder', (0,0), (0, -25), xycoords='axes fraction', textcoords='offset points', va='top', color = '#666666', fontsize=9)
plt.annotate('©UNHCR, The UN Refugee Agency', (0,0), (0, -35), xycoords='axes fraction', textcoords='offset points', va='top', color = '#666666', fontsize=9)

#adjust chart margin and layout
fig.tight_layout()

# Save the figure to the specified path
fig.savefig('plot/stacked-column-basic.png')

#show chart
plt.show()
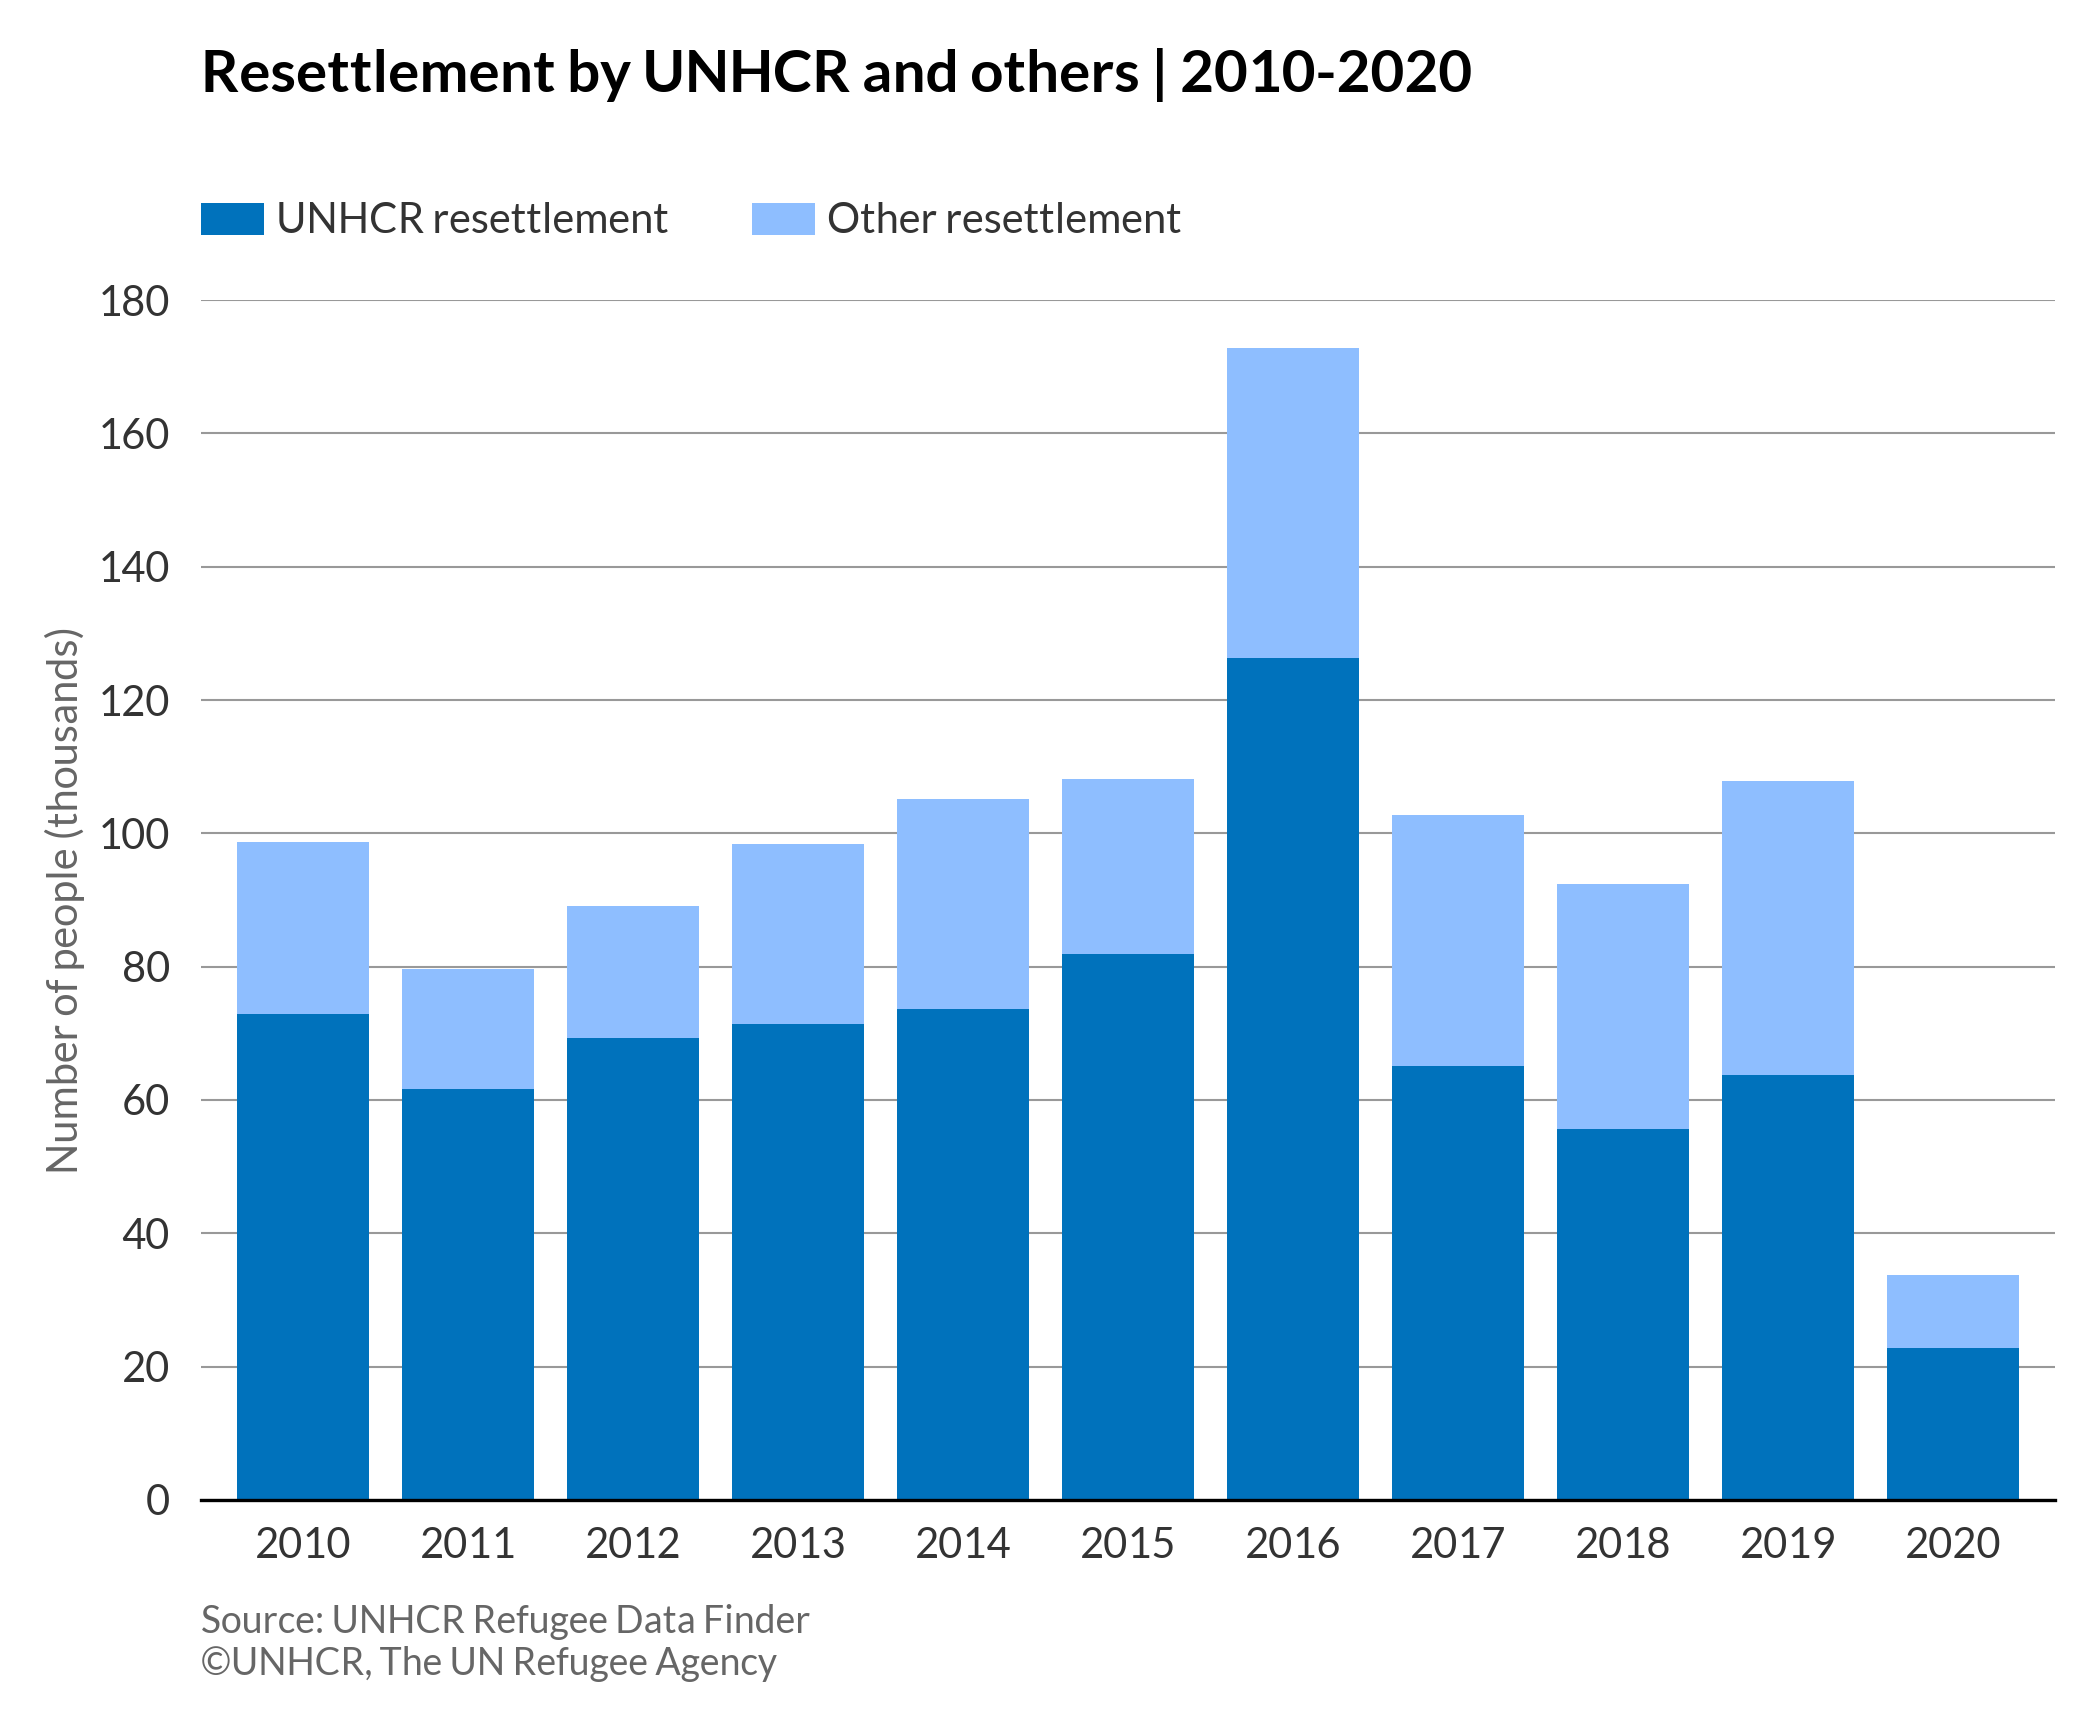
Stacked column chart with data label
# import libraries
import matplotlib.pyplot as plt
import pandas as pd
plt.style.use(['unhcrpyplotstyle','column'])

#load data set
df = pd.read_csv('https://raw.githubusercontent.com/GDS-ODSSS/unhcr-dataviz-platform/master/data/comparison/column_stacked.csv')

#reshape df from long to wide
df = df.pivot(index='year', columns='rst_type', values='rst_in_thousand')
df = df.reset_index()

#prepare data array for plotting
x = df['year']
y1 = df['UNHCR resettlement']
y2 = df['Other resettlement']

#plot the chart
fig, ax = plt.subplots()
rect1=ax.bar(x, y1, label='UNHCR resettlement')
rect2=ax.bar(x, y2, bottom=y1, label='Other resettlement')

#set chart title
ax.set_title('Resettlement by UNHCR and others | 2010-2020', pad=50)

#set subtitle
plt.suptitle('Number of people in thousands', x=0.18, y=0.88)

#set chart legend
ax.legend(loc=(0,1.05), ncol=2)

#set x-axis tick and label
ax.set_xticks(x)

#set formatted data label
ax.bar_label(rect1, label_type='center')
ax.bar_label(rect2, label_type='center')

#set chart source and copyright
plt.annotate('Source: UNHCR Refugee Data Finder', (0,0), (0, -25), xycoords='axes fraction', textcoords='offset points', va='top', color = '#666666', fontsize=9)
plt.annotate('©UNHCR, The UN Refugee Agency', (0,0), (0, -35), xycoords='axes fraction', textcoords='offset points', va='top', color = '#666666', fontsize=9)

#adjust chart margin and layout
fig.tight_layout()

# Save the figure to the specified path
fig.savefig('plot/stacked-column-labels.png')

#show chart
plt.show()
