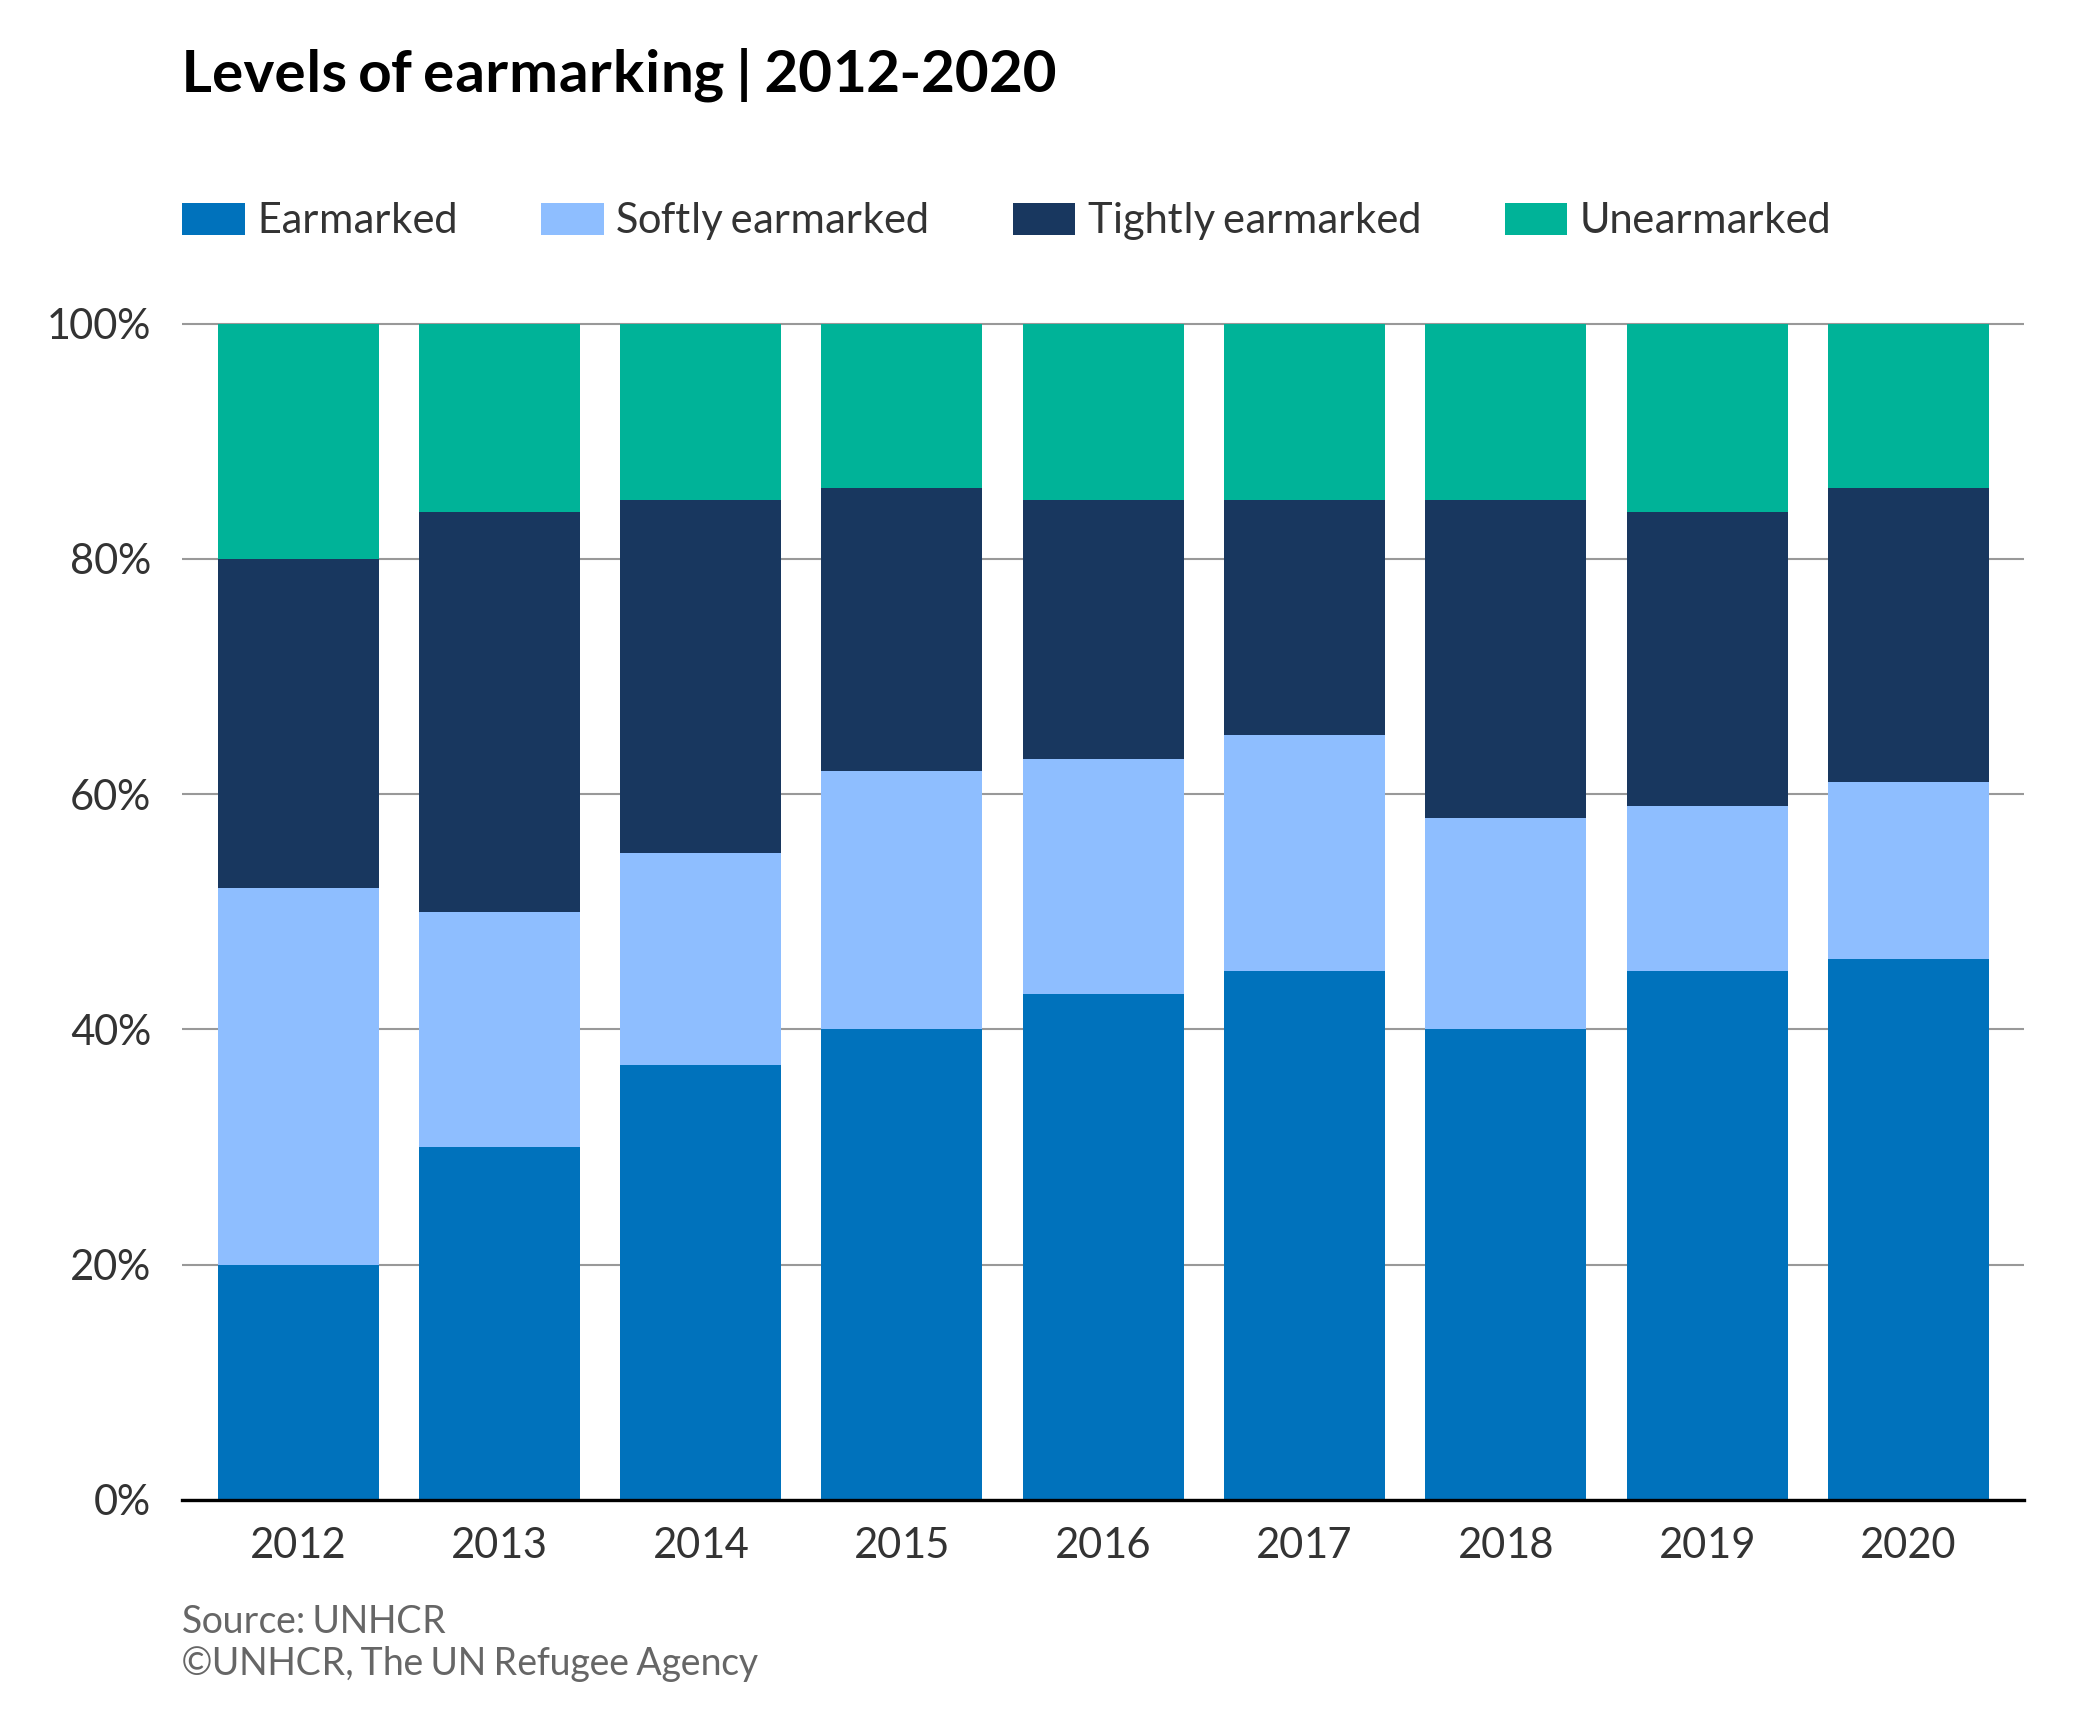
100% stacked column chart
100% stacked column charts are similar to stacked column charts in that categories are represented as vertical bars and series as components of those bars. However, in a 100% stacked column chart, each series bar represents the percentage of the whole to which it belongs, where the total (cumulative) of each stacked bar always equals 100%.
More about: 100% stacked column chart - Other tutorials: R D3
# import libraries
import numpy as np
import matplotlib.pyplot as plt
import pandas as pd
import matplotlib.ticker as mticker
plt.style.use(['unhcrpyplotstyle','column'])

#load data set
df = pd.read_csv('https://raw.githubusercontent.com/GDS-ODSSS/unhcr-dataviz-platform/master/data/part_to_a_whole/column_stacked_100perc.csv')

#reshape df from long to wide
df = df.pivot(index='year', columns='funding_type', values='percentage')
df = df.reset_index()

#compute data array for plotting
x = df['year']
y1 = df['Earmarked']
y2 = df['Softly earmarked']
y3 = df['Tightly earmarked']
y4 = df['Unearmarked']

b_y3 = np.array(y1)+np.array(y2)
b_y4 = np.array(y1)+np.array(y2)+np.array(y3)

#plot the chart
fig, ax = plt.subplots()
rect1=ax.bar(x, y1, label='Earmarked')
rect2=ax.bar(x, y2, bottom=y1, label='Softly earmarked')
rect3=ax.bar(x, y3, bottom=b_y3,label='Tightly earmarked')
rect4=ax.bar(x, y4, bottom=b_y4,label='Unearmarked')

# after plotting the data, format the labels
ticks_loc = ax.get_yticks()
tickloc=ax.yaxis.set_major_locator(mticker.FixedLocator(ticks_loc))
ticklab=ax.set_yticklabels(['{:,.0%}'.format(x) for x in ticks_loc])

#set chart title
ax.set_title('Levels of earmarking | 2012-2020', pad=50)

#set tick parameters
ax.tick_params(labelleft=True)

#set x-axis tick and label
ax.set_xticks(x)

#set chart legend
ax.legend(loc=(0,1.05), ncol=4)

#show grid below the bars
ax.grid(axis='y')

#set chart source and copyright
plt.annotate('Source: UNHCR', (0,0), (0, -25), xycoords='axes fraction', textcoords='offset points', va='top', color = '#666666', fontsize=9)
plt.annotate('©UNHCR, The UN Refugee Agency', (0,0), (0, -35), xycoords='axes fraction', textcoords='offset points', va='top', color = '#666666', fontsize=9)

#adjust chart margin and layout
fig.tight_layout()

# Save the figure to the specified path
fig.savefig('plot/column-stacked-100perc.png')

#show chart
plt.show()

Donut chart
The donut chart is a variation of a pie charts, with the total amount divided into categories based on a proportional value. For the most part, there aren’t significant differences between a pie chart and a donut chart, so the choice of a donut over a standard circle is mostly aesthetic. One small advantage for the ring shape is that the central area can be used to show additional information such as the total amount figure.
More about: Donut chart - Other tutorials: R D3
# import libraries
import numpy as np
import matplotlib.pyplot as plt
import pandas as pd
plt.style.use(['unhcrpyplotstyle', 'donut'])

#load and reshape the data
df = pd.read_csv('https://raw.githubusercontent.com/GDS-ODSSS/unhcr-dataviz-platform/master/data/part_to_a_whole/pie.csv')

#compute data for plotting
labels = df['funding_type']
values = df['funding_value']

#plot the chart
fig, ax = plt.subplots()
pie=ax.pie(values, labels=labels, autopct='%1.1f%%', pctdistance = 0.75, counterclock=False, startangle=-270, wedgeprops={'width':0.5, 'edgecolor':'white', 'linewidth': 2})

#set chart title
ax.set_title('UNHCR Funding (as of February 2022)')

#set chart source and copyright
plt.annotate('Source: UNHCR', (0,0), (0, -25), xycoords='axes fraction', textcoords='offset points', va='top', color = '#666666', fontsize=9)
plt.annotate('©UNHCR, The UN Refugee Agency', (0,0), (0, -35), xycoords='axes fraction', textcoords='offset points', va='top', color = '#666666', fontsize=9)

#adjust chart margin and layout
fig.tight_layout()

# Save the figure to the specified path
fig.savefig('plot/donut-chart.png')

#show chart
plt.show()

Pie chart
A pie chart shows how a total amount is divided between different categorical variables as a circle divided into proportional segments. Each categorical value corresponds with a single slice of the circle, and each arc length indicates the proportion of each category.
# import libraries
import numpy as np
import matplotlib.pyplot as plt
import pandas as pd
plt.style.use(['unhcrpyplotstyle','pie'])

#load and reshape the data
df = pd.read_csv('https://raw.githubusercontent.com/GDS-ODSSS/unhcr-dataviz-platform/master/data/part_to_a_whole/pie.csv')

#compute data for plotting
labels = df['funding_type']
values = df['funding_value']

#plot the chart
fig, ax = plt.subplots()
pie=ax.pie(values, labels=labels, autopct='%1.1f%%', pctdistance = 0.75, counterclock=False, startangle=-270)

#set chart title
ax.set_title('UNHCR Funding (as of February 2022)')

#set chart source and copyright
plt.annotate('Source: UNHCR', (0,0), (0, -25), xycoords='axes fraction', textcoords='offset points', va='top', color = '#666666', fontsize=9)
plt.annotate('©UNHCR, The UN Refugee Agency', (0,0), (0, -35), xycoords='axes fraction', textcoords='offset points', va='top', color = '#666666', fontsize=9)

#adjust chart margin and layout
fig.tight_layout()

# Save the figure to the specified path
fig.savefig('plot/pie-chart.png')

#show chart
plt.show()

Treemap
As a variation of a tree diagram, a treemap is meant to show hierarchical structure using the size of the rectangle to represent quantity. Each category is assigned a rectangle, with subcategories displayed inside the large rectangle, in proportionate size against each other.
# import libraries
import matplotlib.pyplot as plt
import squarify
import pandas as pd
plt.style.use(['unhcrpyplotstyle','treemap'])

#load and reshape the data
df = pd.read_csv('https://raw.githubusercontent.com/GDS-ODSSS/unhcr-dataviz-platform/master/data/part_to_a_whole/treemap.csv')

#compute data for plotting
sizes = df['staff_number']
label = df['region']

#calculate percentage
df['percent'] = (df['staff_number'] /
                  df['staff_number'].sum()) * 100
list = df['percent']
new_list = [f'{i:.1f}% \n' for i in list]

#plot the chart
fig, ax = plt.subplots()
treemap = squarify.plot(sizes=sizes, label=new_list+label, color='#0072BC', ec='#ffffff', text_kwargs={"color":"#ffffff"})
noax = plt.axis('off')

#set chart title
plt.title('UNHCR global workforce by region | 2021')

#set chart source and copyright
plt.annotate('Source: UNHCR', (0,0), (0, -10), xycoords='axes fraction', textcoords='offset points', va='top', color = '#666666', fontsize=9)
plt.annotate('©UNHCR, The UN Refugee Agency', (0,0), (0, -20), xycoords='axes fraction', textcoords='offset points', va='top', color = '#666666', fontsize=9)

#adjust chart margin and layout
fig.tight_layout()

# Save the figure to the specified path
fig.savefig('plot/treemap.png')

#show chart
plt.show()
