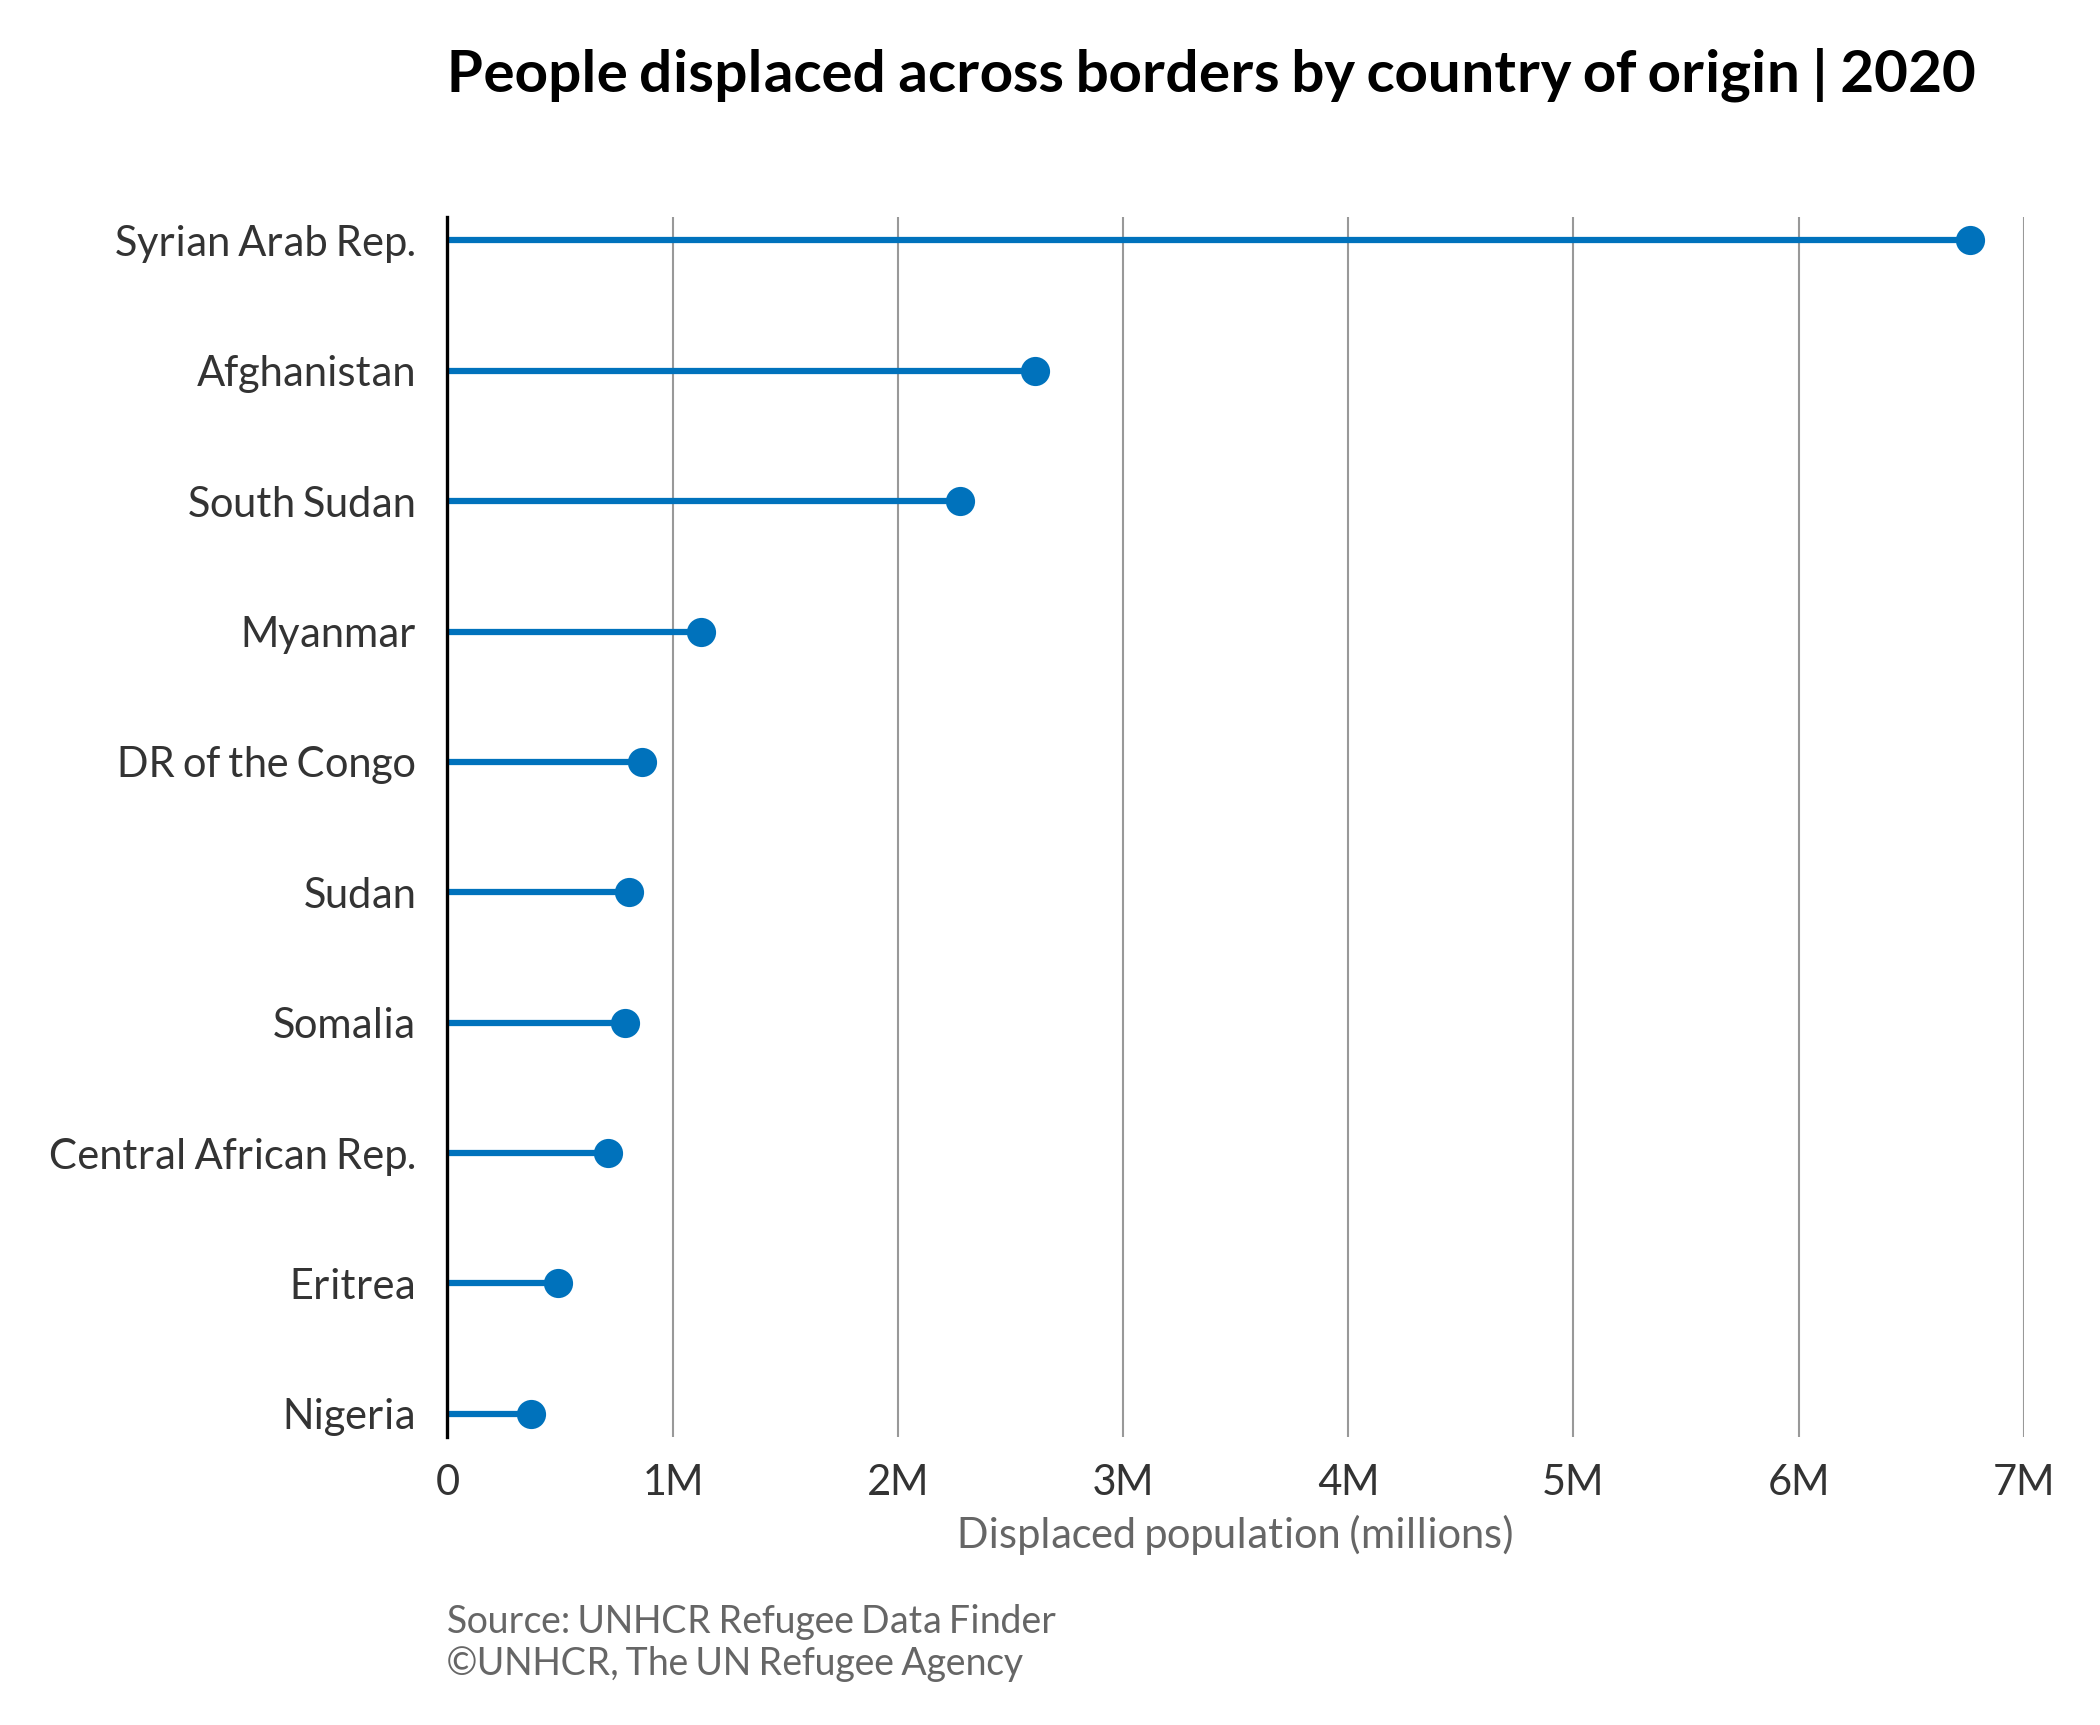
Lollipop chart
As a variant of the bar/column chart, the lollipop chart consists of lines and dots at the end to highlight the values. Like a bar chart, a lollipop chart is used to compare categorical data.
More about: Lollipop chart - Other tutorials: R
# import libraries
import numpy as np
import matplotlib.pyplot as plt
import pandas as pd
plt.style.use(['unhcrpyplotstyle','lollipop'])

#load data set
df = pd.read_csv('https://raw.githubusercontent.com/GDS-ODSSS/unhcr-dataviz-platform/master/data/ranking/lollipop.csv')

#sort value by descending order
df.sort_values('displaced_number',inplace=True)

#compute data array for plotting
x = df.loc[:, 'country_origin'].values
y = df.loc[:, 'displaced_number'].values

#plot the chart
fig, ax = plt.subplots()
ax.hlines(y=x, xmin=0, xmax=y)
ax.plot(y, x, 'o')

#set x-axis limit
xlimt = plt.xlim(0,7*1e6)

#set chart title
ax.set_title('People displaced across borders by country of origin | 2020')

#set x-axis label
ax.set_xlabel('Displaced population (millions)')

#format x-axis tick labels
def number_formatter(x, pos):
    if x >= 1e6:
        s = '{:1.0f}M'.format(x*1e-6)
    elif x < 1e6 and x >= 1e3:
        s = '{:1.0f}K'.format(x*1e-3)
    else:
        s = '{:1.0f}'.format(x)
    return s
ax.xaxis.set_major_formatter(number_formatter)

#set chart source and copyright
plt.annotate('Source: UNHCR Refugee Data Finder', (0,0), (0, -40), xycoords='axes fraction', textcoords='offset points', va='top', color = '#666666', fontsize=9)
plt.annotate('©UNHCR, The UN Refugee Agency', (0,0), (0, -50), xycoords='axes fraction', textcoords='offset points', va='top', color = '#666666', fontsize=9)

#adjust chart margin and layout
fig.tight_layout()

# Save the figure to the specified path
fig.savefig('plot/lollipop-chart.png')

#show chart
plt.show()
Ordered bar chart
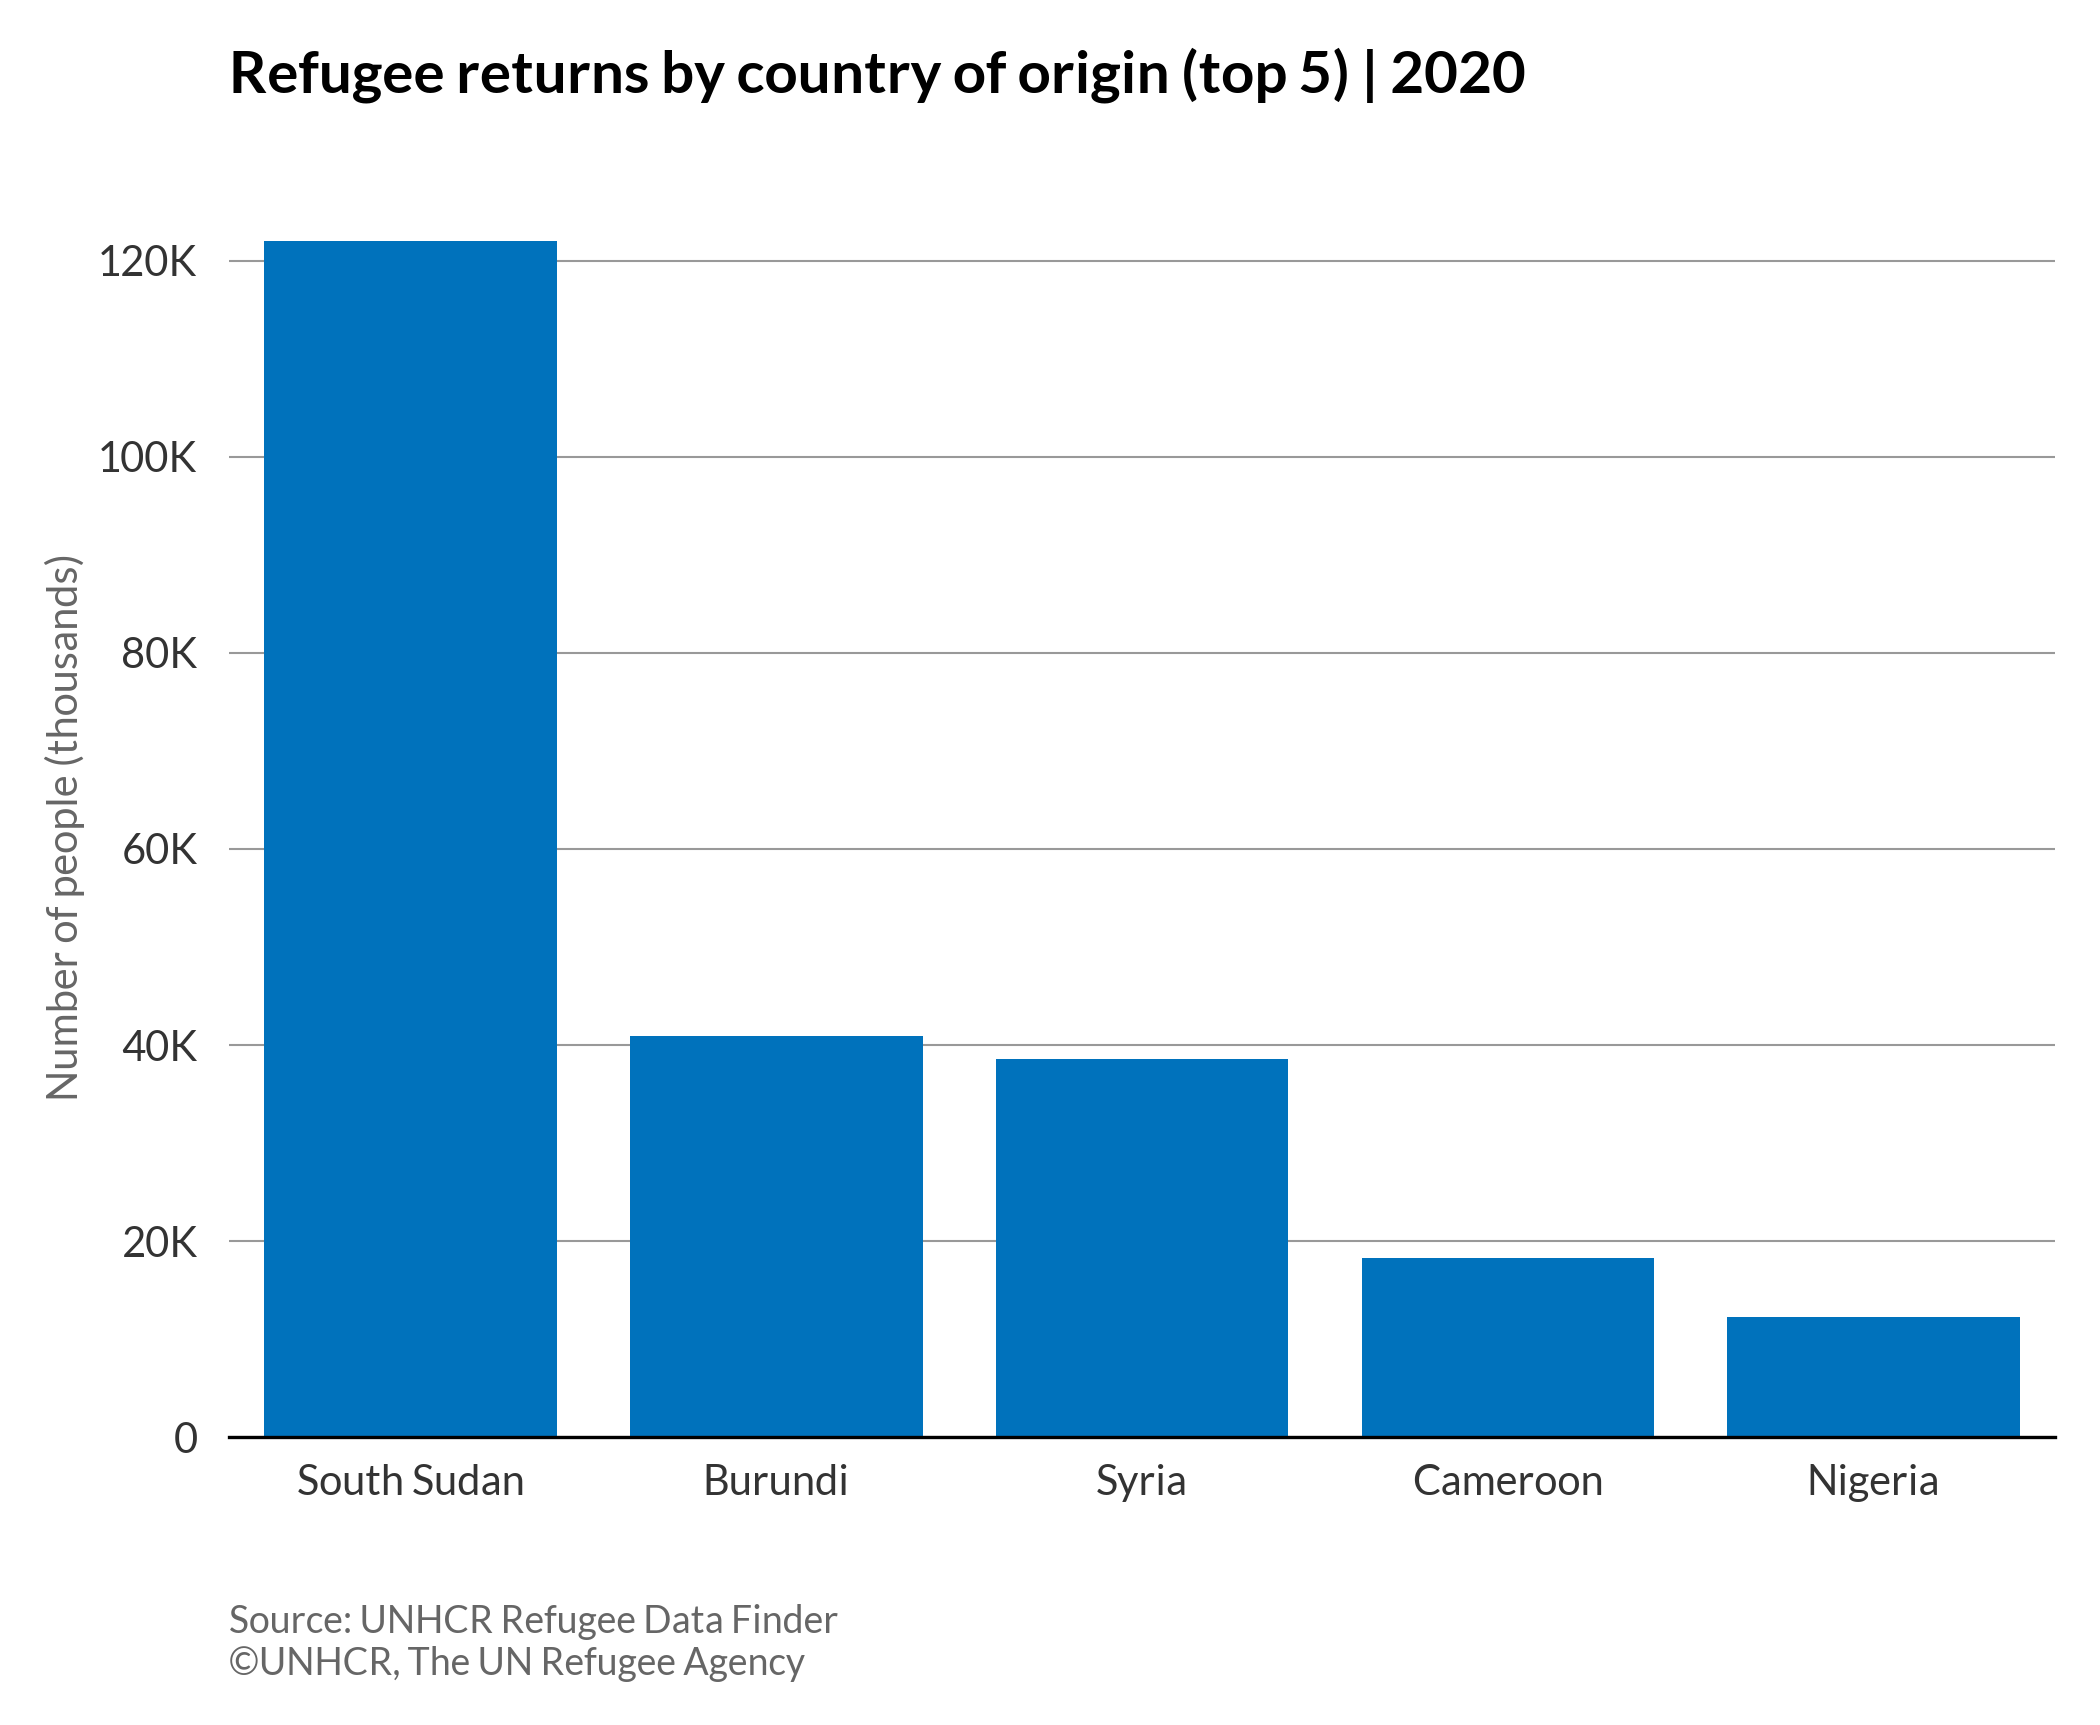
An ordered bar chart is a chart in which each category is represented by a horizontal rectangle, with the length of the rectangle being ordered and proportional to the values being plotted.
More about: Ordered bar chart - Other tutorials: R
Basic ordered bar chart
# import libraries
import numpy as np
import matplotlib.pyplot as plt
import pandas as pd
plt.style.use(['unhcrpyplotstyle','bar'])

#load data set
df = pd.read_csv('https://raw.githubusercontent.com/GDS-ODSSS/unhcr-dataviz-platform/master/data/ranking/bar_ordered.csv')

#sort value by descending order
df.sort_values('returnee_number',inplace=True)

#compute data array for plotting
x = df.loc[:, 'country_origin'].values
y = df.loc[:, 'returnee_number'].values

#plot the chart
fig, ax = plt.subplots()
bar_plot = ax.barh(x, y)

#set chart title
ax.set_title('Refugee returns by country of origin (top 5) | 2020')

#set x-axis label
ax.set_xlabel('Number of people (thousands)')

#set tick parameters
ax.tick_params(labelbottom=True)

#show grid below the bars
ax.grid(axis='x')

#format y-axis tick labels
def number_formatter(x, pos):
    if x >= 1e6:
        s = '{:1.0f}M'.format(x*1e-6)
    elif x < 1e6 and x > 0:
        s = '{:1.0f}K'.format(x*1e-3)
    else:
        s = '{:1.0f}'.format(x)
    return s
ax.xaxis.set_major_formatter(number_formatter)

#set chart source and copyright
plt.annotate('Source: UNHCR Refugee Data Finder', (0,0), (0, -40), xycoords='axes fraction', textcoords='offset points', va='top', color = '#666666', fontsize=9)
plt.annotate('©UNHCR, The UN Refugee Agency', (0,0), (0, -50), xycoords='axes fraction', textcoords='offset points', va='top', color = '#666666', fontsize=9)

#adjust chart margin and layout
fig.tight_layout()

# Save the figure to the specified path
fig.savefig('plot/ordered-bar-basic.png')

#show chart
plt.show()
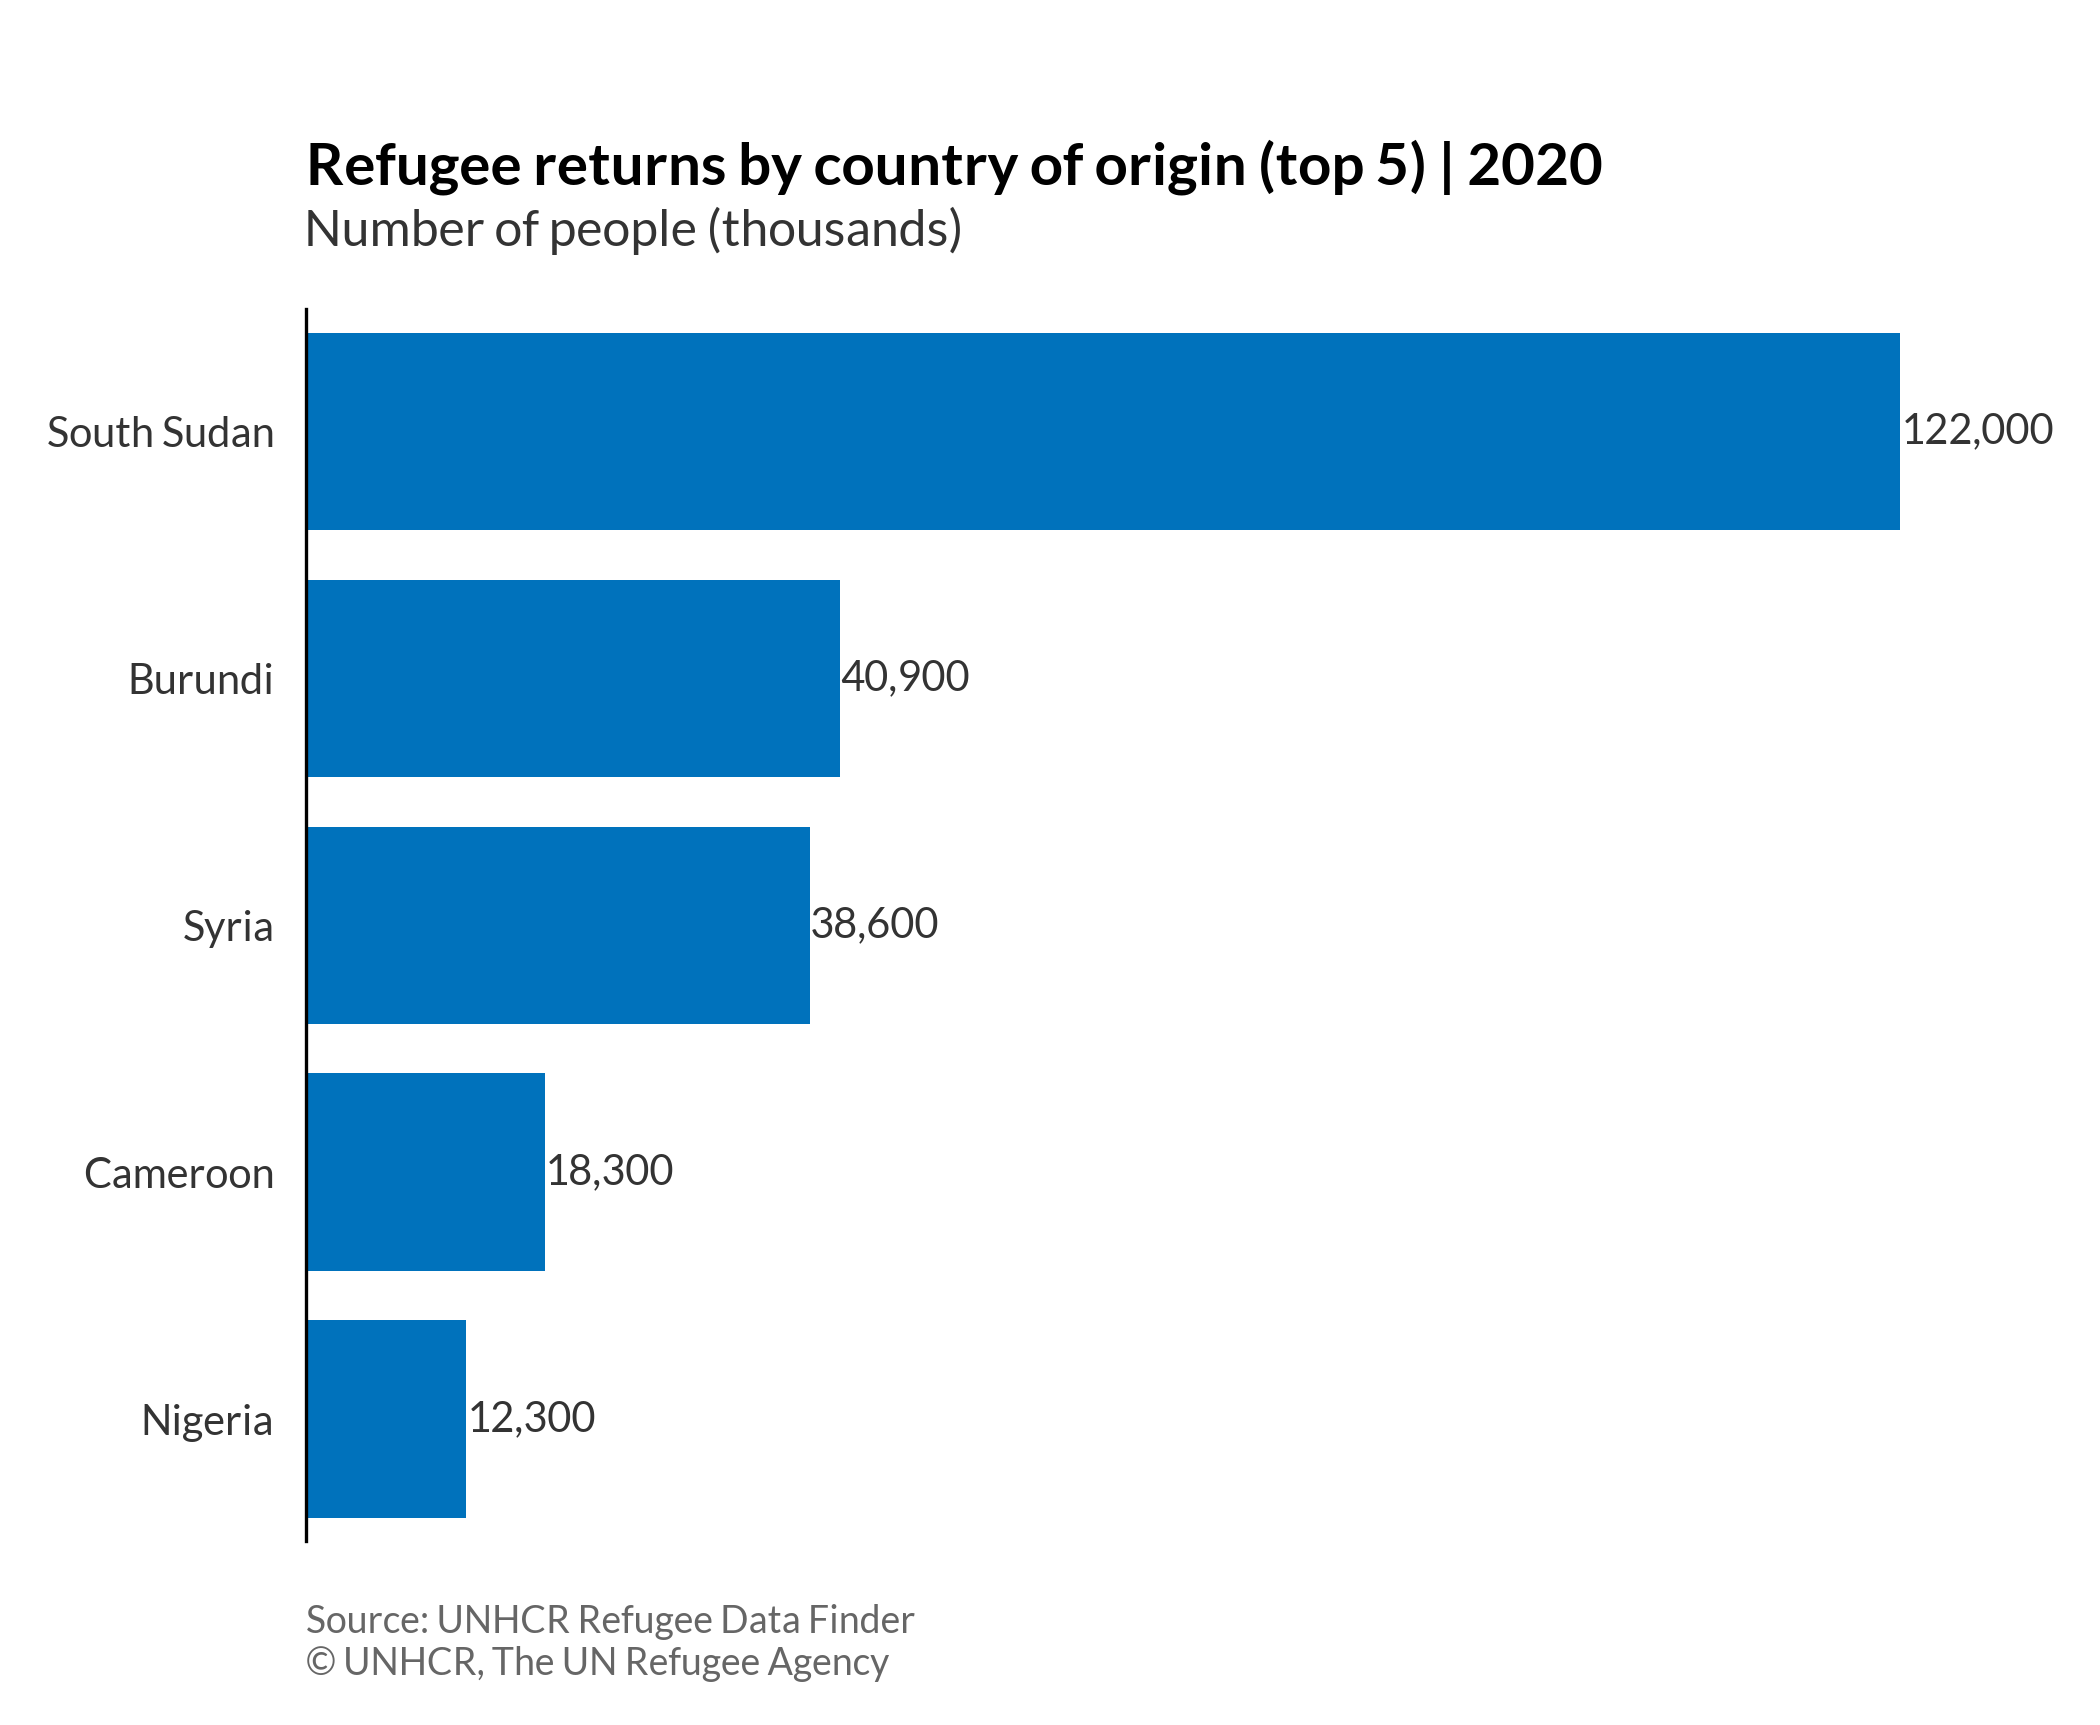
Ordered bar chart with data label
# import libraries
import numpy as np
import matplotlib.pyplot as plt
import pandas as pd
plt.style.use(['unhcrpyplotstyle','bar'])

#load data set
df = pd.read_csv('https://raw.githubusercontent.com/GDS-ODSSS/unhcr-dataviz-platform/master/data/ranking/bar_ordered.csv')

#sort value in descending order
df.sort_values('returnee_number', inplace=True)

#prepare data array for plotting
x = df.loc[:, 'country_origin'].values
y = df.loc[:, 'returnee_number'].values

#plot the chart
fig, ax = plt.subplots()
bar_plot = ax.barh(x, y)

#set chart tit
ax.set_title('Refugee returns by country of origin (top 5) | 2020')

#set subtitle
plt.suptitle('Number of people (thousands)', x=0.145, y=0.88, ha='left')

#set data label
ax.bar_label(bar_plot, labels=[f'{x:,.0f}' for x in bar_plot.datavalues])

#set chart source and copyright
plt.annotate('Source: UNHCR Refugee Data Finder', (0,0), (0, -15), xycoords='axes fraction', textcoords='offset points', va='top', color = '#666666', fontsize=9)
plt.annotate('© UNHCR, The UN Refugee Agency', (0,0), (0, -25), xycoords='axes fraction', textcoords='offset points', va='top', color = '#666666', fontsize=9)

#adjust chart margin and layout
fig.tight_layout()

# Save the figure to the specified path
fig.savefig('plot/ordered-bar-labels.png')

#show charts
plt.show()
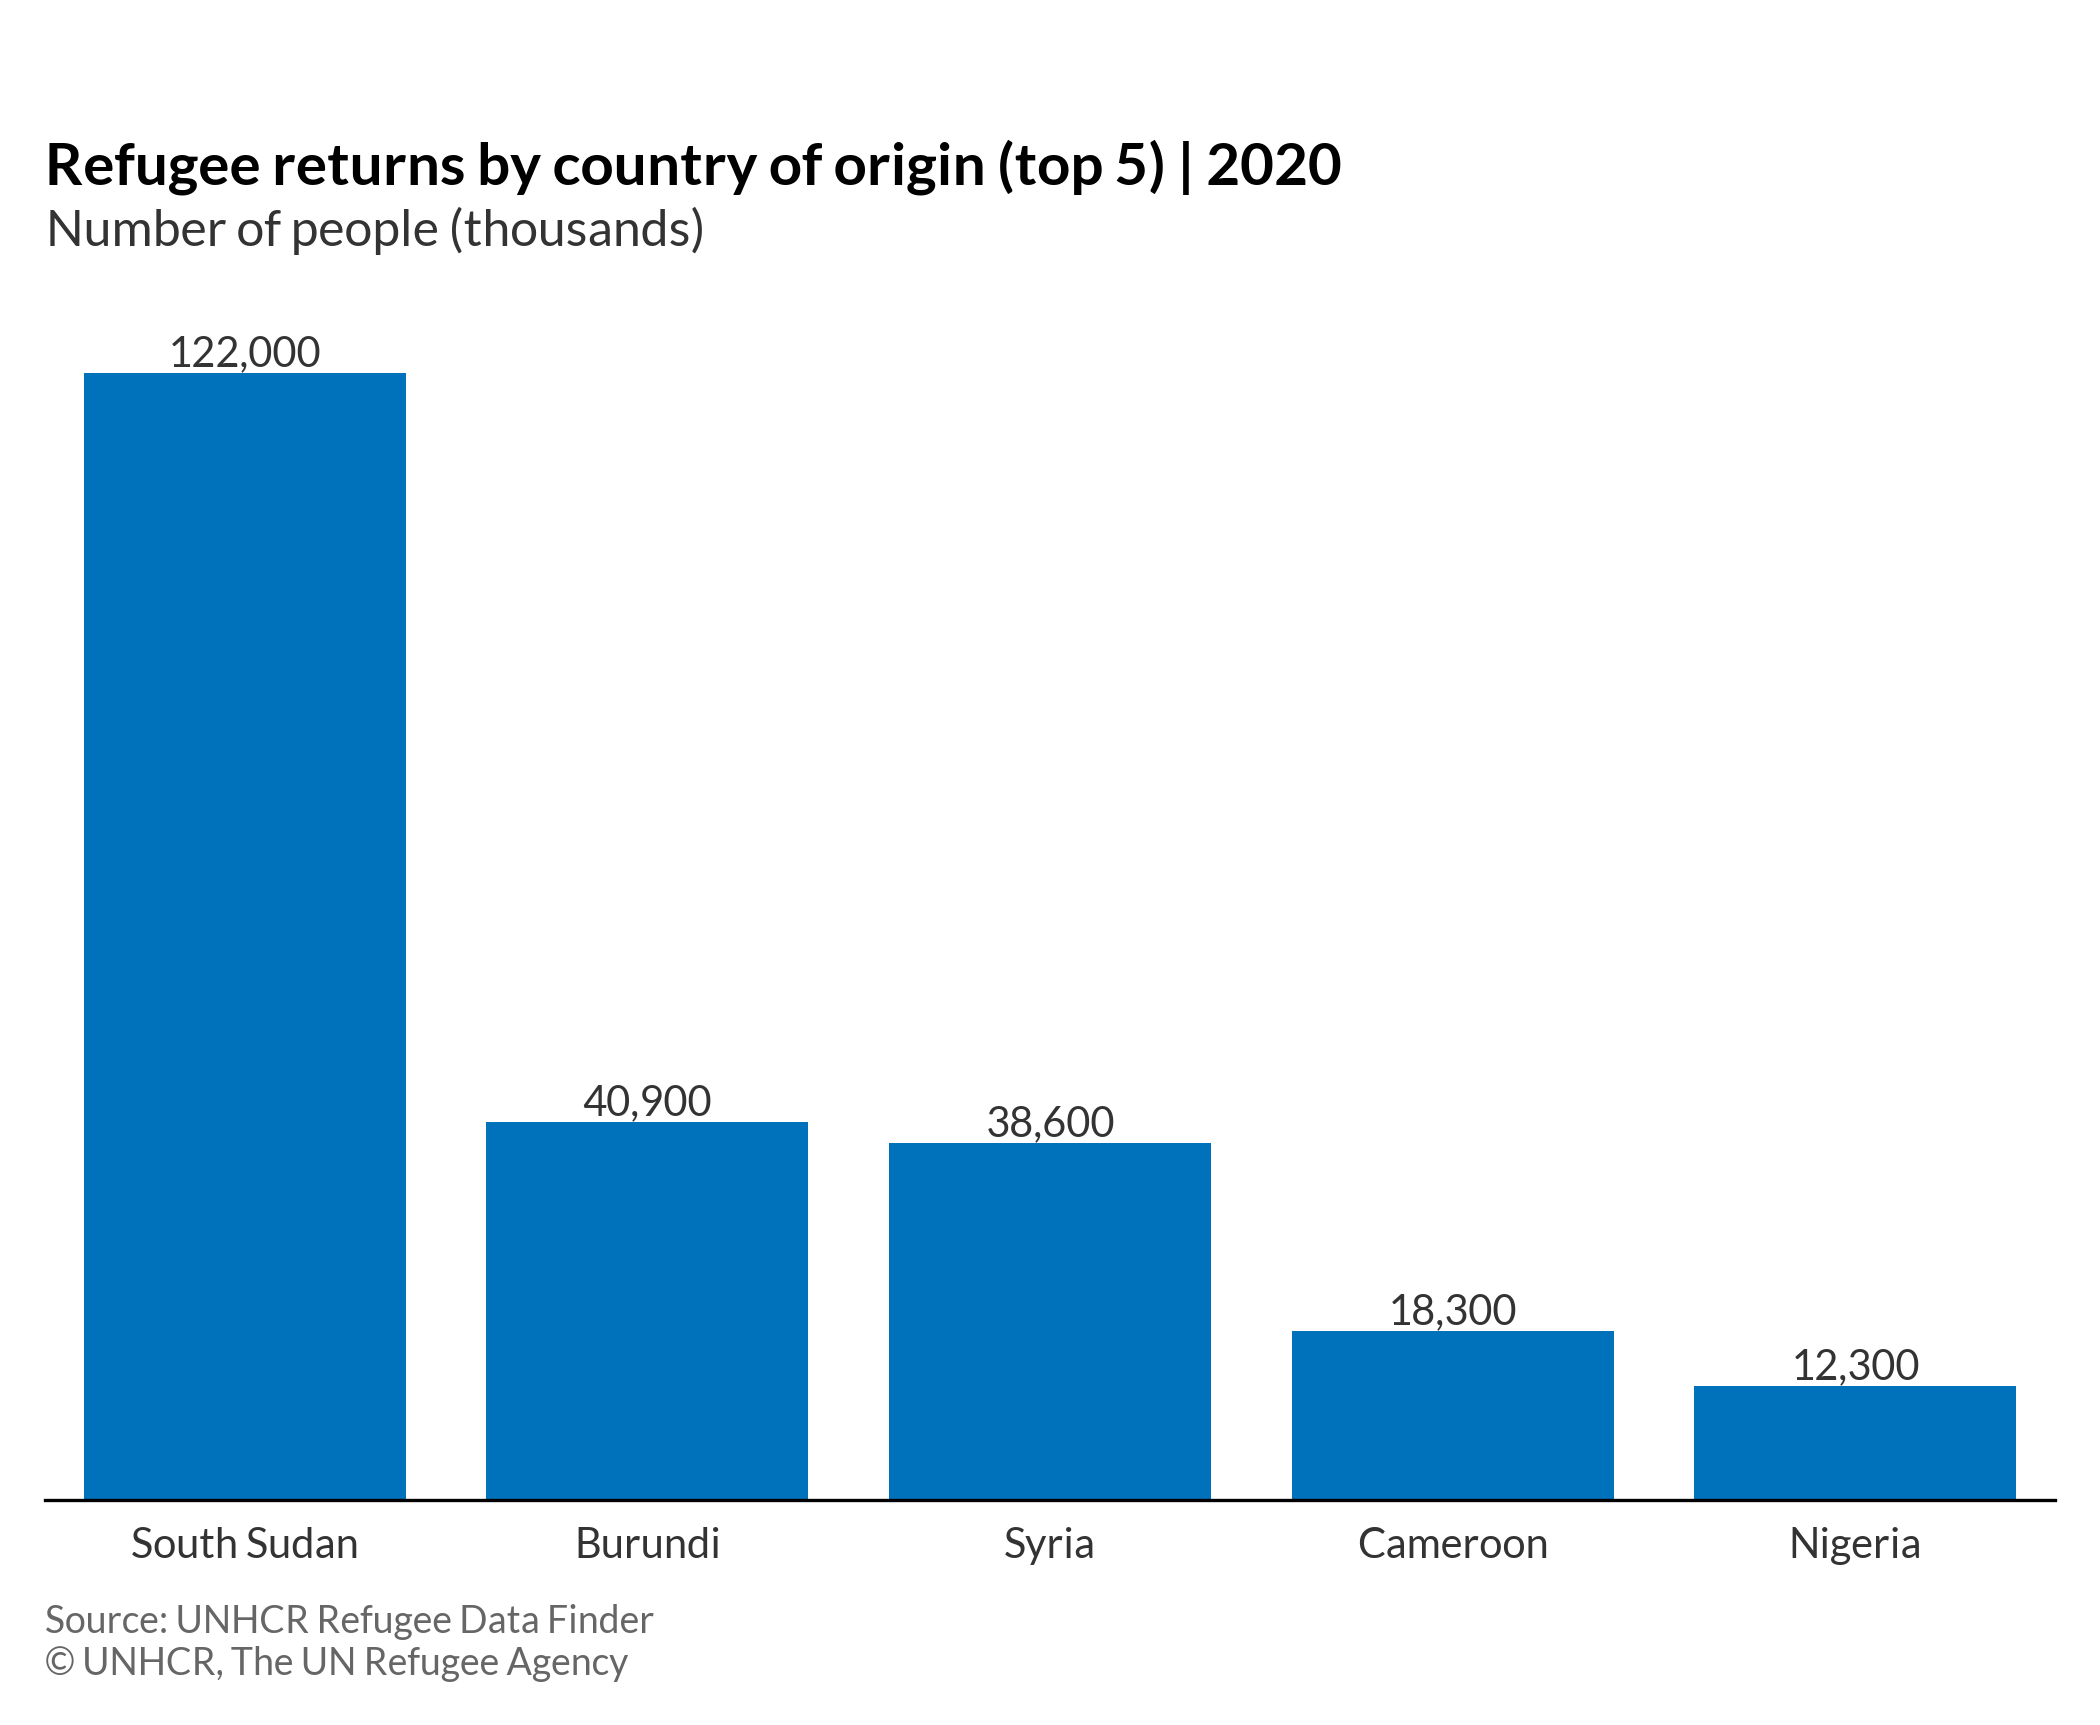
Ordered column chart
An ordered column chart is a chart in which each category is represented by a vertical rectangle, with the height of the rectangle being ordered and proportional to the values being plotted.
More about: Ordered column chart - Other tutorials: R
Basic ordered column chart
# import libraries
import numpy as np
import matplotlib.pyplot as plt
import pandas as pd
plt.style.use(['unhcrpyplotstyle','column'])

#load data set
df = pd.read_csv('https://raw.githubusercontent.com/GDS-ODSSS/unhcr-dataviz-platform/master/data/ranking/column_ordered.csv')

#sort value by descending order
df.sort_values('returnee_number', ascending=False, inplace=True)

#compute data array for plotting
x = df.loc[:, 'country_origin'].values
y = df.loc[:, 'returnee_number'].values

#plot the chart
fig, ax = plt.subplots()
bar_plot = ax.bar(x, y)

#set chart title
ax.set_title('Refugee returns by country of origin (top 5) | 2020')

#set y-axis label
ax.set_ylabel('Number of people (thousands)')

#set tick parameters
ax.tick_params(labelleft=True)

#show grid below the bars
ax.grid(axis='y')

#format y-axis tick labels
def number_formatter(x, pos):
    if x >= 1e6:
        s = '{:1.0f}M'.format(x*1e-6)
    elif x < 1e6 and x > 0:
        s = '{:1.0f}K'.format(x*1e-3)
    else:
        s = '{:1.0f}'.format(x)
    return s
ax.yaxis.set_major_formatter(number_formatter)

#set chart source and copyright
plt.annotate('Source: UNHCR Refugee Data Finder', (0,0), (0, -40), xycoords='axes fraction', textcoords='offset points', va='top', color = '#666666', fontsize=9)
plt.annotate('©UNHCR, The UN Refugee Agency', (0,0), (0, -50), xycoords='axes fraction', textcoords='offset points', va='top', color = '#666666', fontsize=9)

#adjust chart margin and layout
fig.tight_layout()

# Save the figure to the specified path
fig.savefig('plot/ordered-bar-basic.png')

#show chart
plt.show()

Ordered column chart with data label
# import libraries
import numpy as np
import matplotlib.pyplot as plt
import pandas as pd
plt.style.use(['unhcrpyplotstyle','column'])

#load data set
df = pd.read_csv('https://raw.githubusercontent.com/GDS-ODSSS/unhcr-dataviz-platform/master/data/ranking/column_ordered.csv')

#sort value in descending order
df.sort_values('returnee_number', ascending=False, inplace=True)

#prepare data array for plotting
x = df.loc[:, 'country_origin'].values
y = df.loc[:, 'returnee_number'].values

#plot the chart
fig, ax = plt.subplots()
bar_plot = ax.bar(x, y)

#set chart title
ax.set_title('Refugee returns by country of origin (top 5) | 2020', pad=40)

#set subtitle
plt.suptitle('Number of people (thousands)', x=0.022, y=0.88, ha='left')

# set data label
ax.bar_label(bar_plot, labels=[f'{x:,.0f}' for x in bar_plot.datavalues])

#set chart source and copyright
plt.annotate('Source: UNHCR Refugee Data Finder', (0,0), (0, -25), xycoords='axes fraction', textcoords='offset points', va='top', color = '#666666', fontsize=9)
plt.annotate('© UNHCR, The UN Refugee Agency', (0,0), (0, -35), xycoords='axes fraction', textcoords='offset points', va='top', color = '#666666', fontsize=9)

#adjust chart margin and layout
fig.tight_layout()

# Save the figure to the specified path
fig.savefig('plot/ordered-column-labels.png')

#show charts
plt.show()
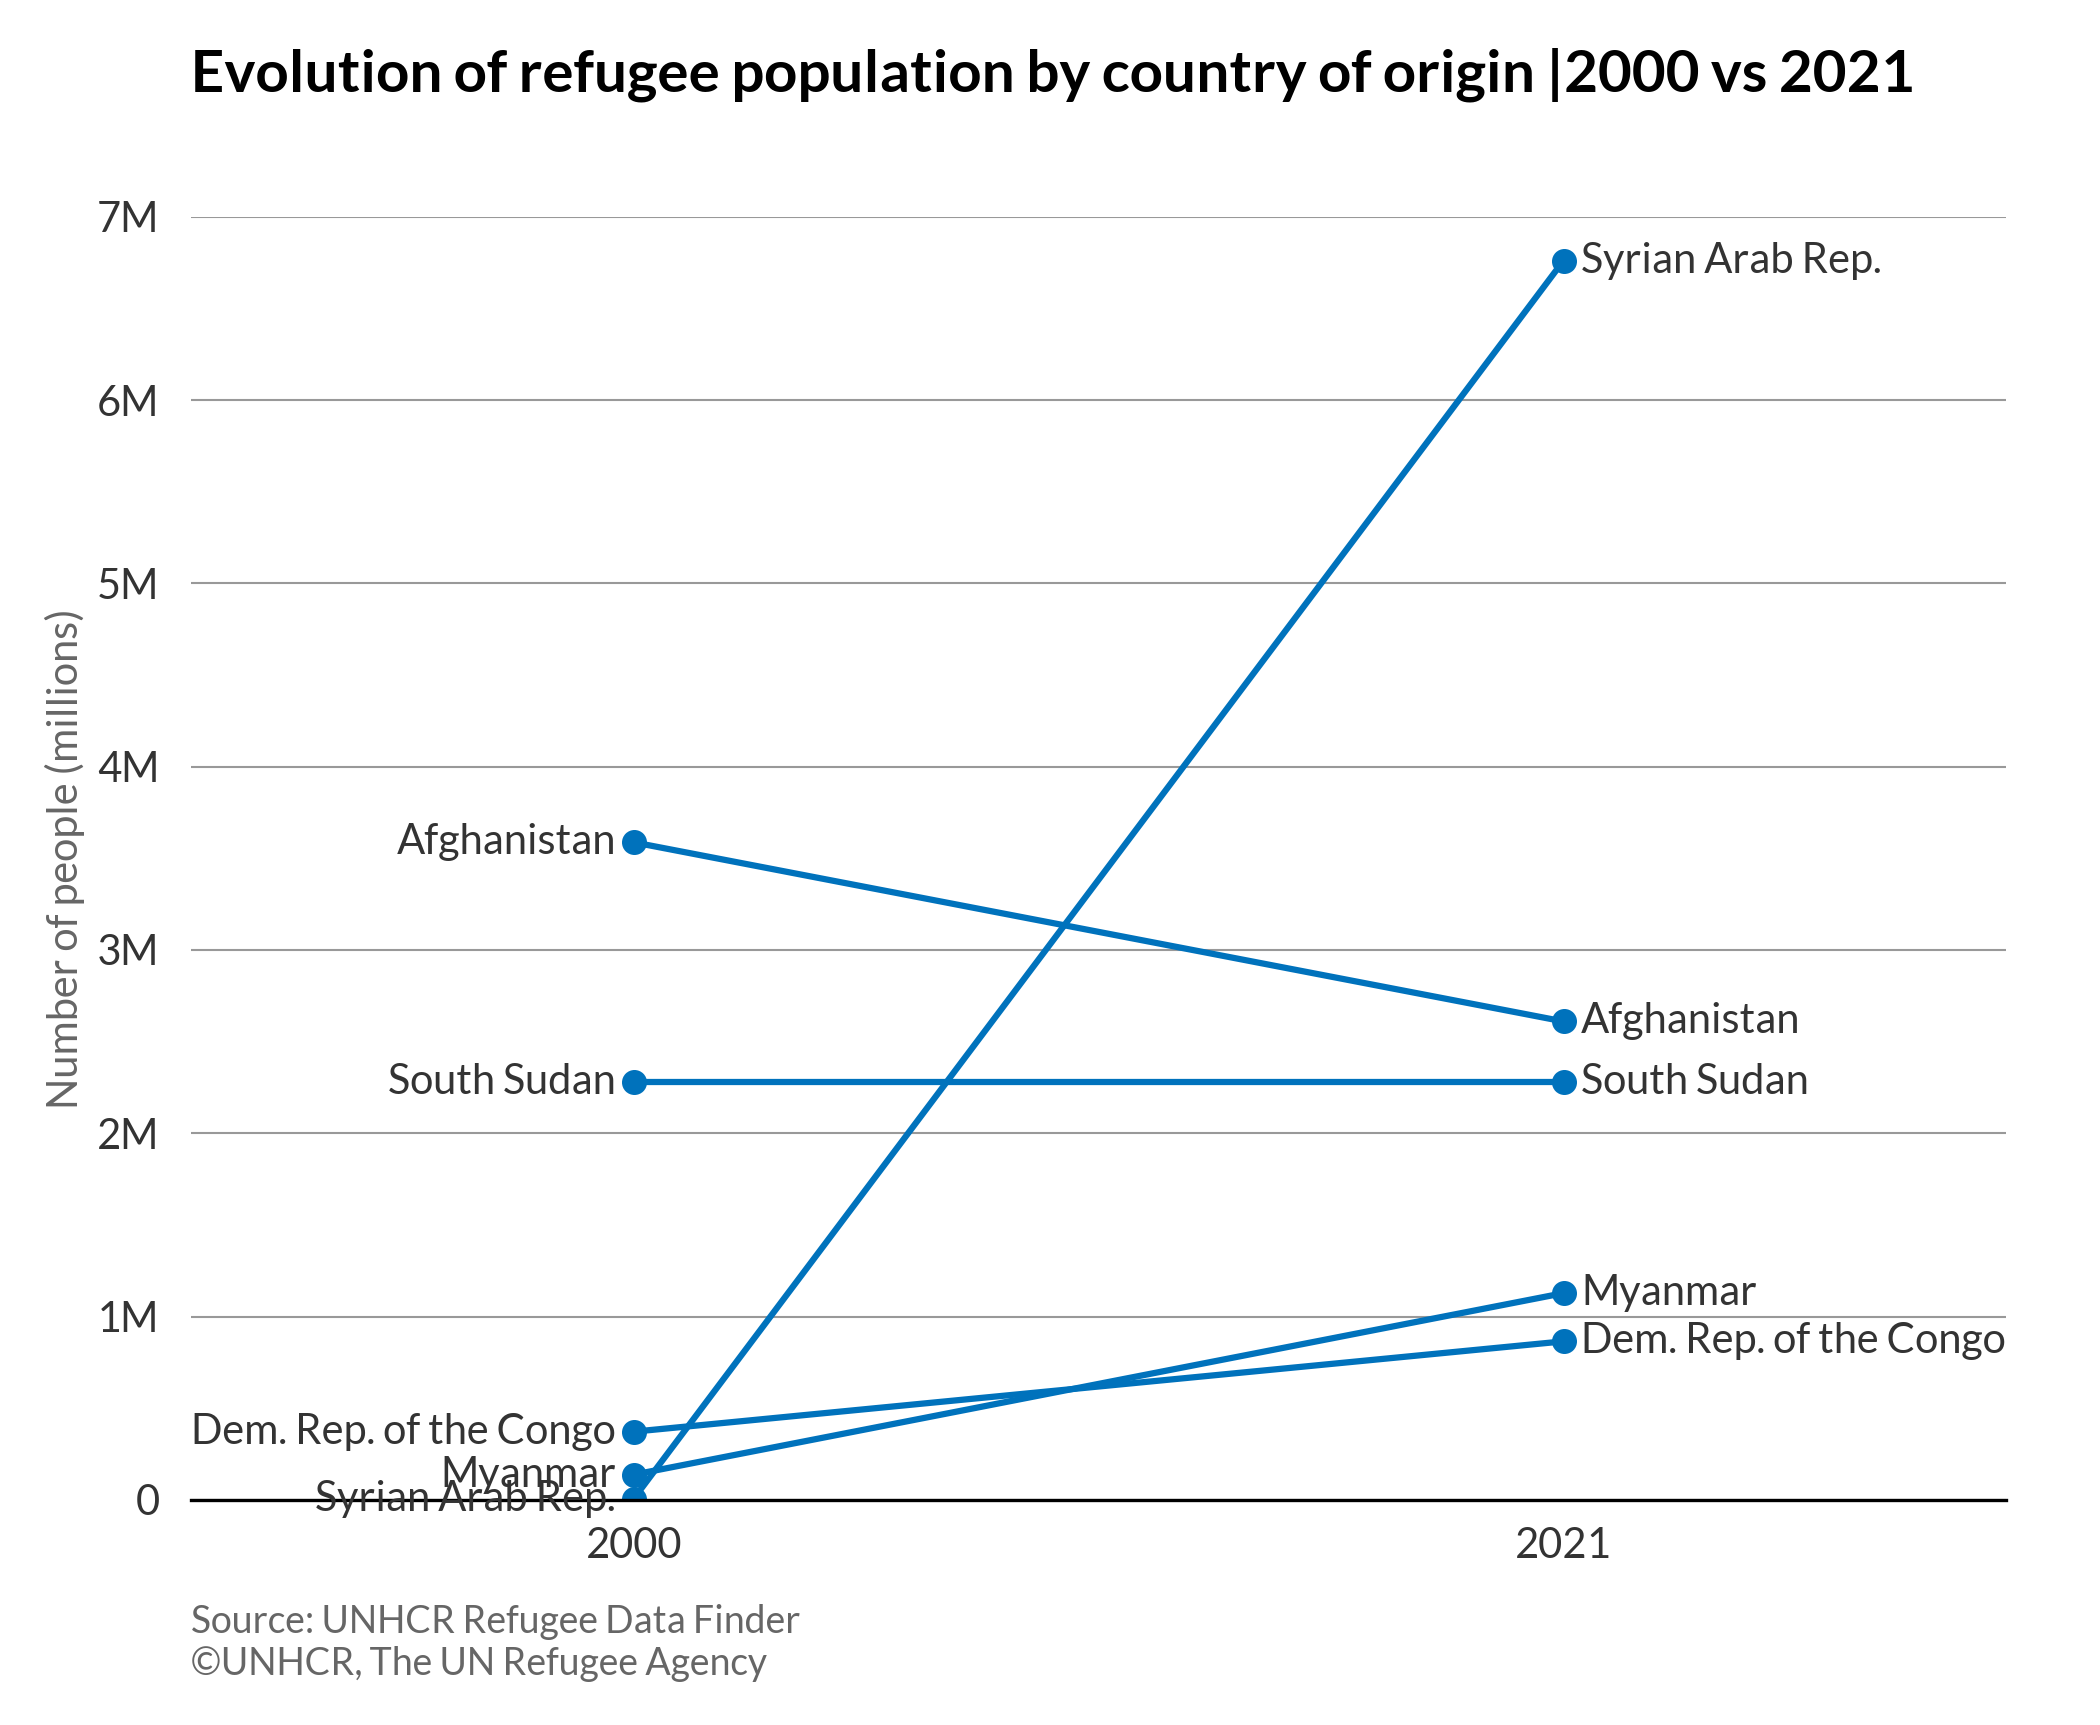
Slope chart
A slope chart looks like a line chart, but unlike the line chart, it has only two data points for each line. The change between two data points can be easily identified with connected lines (slope up means increase, slope down means decrease).
More about: Slope chart - Other tutorials: R
# import libraries
import numpy as np
import matplotlib.pyplot as plt
import pandas as pd
plt.style.use(['unhcrpyplotstyle','slope'])

#load and reshape the data
df = pd.read_csv('https://raw.githubusercontent.com/GDS-ODSSS/unhcr-dataviz-platform/master/data/change_over_time/slope_2.csv')

#set a list of country names
countries=['Afghanistan','Dem. Rep. of the Congo','Myanmar','South Sudan','Syrian Arab Rep.']

#plot the chart
fig, ax = plt.subplots()
for i in countries:
    temp = df[df['country_origin'] == i]
    plt.plot(temp.year, temp.refugees_number, color='#0072BC', marker='o', markersize=5)
    # start label
    plt.text(temp.year.values[0]-0.4, temp.refugees_number.values[0], i, ha='right', va='center')
    # end label
    plt.text(temp.year.values[1]+0.4, temp.refugees_number.values[1], i, ha='left', va='center')

ticks = plt.xticks([2000, 2021])
xl = plt.xlim(1990,2031)
yl = plt.ylim(0, 7*1e6)

#set chart title
ax.set_title('Evolution of refugee population by country of origin |2000 vs 2021')

#set y-axis label
ax.set_ylabel('Number of people (millions)')

#format x-axis tick labels
def number_formatter(x, pos):
    if x >= 1e6:
        s = '{:1.0f}M'.format(x*1e-6)
    elif x < 1e6 and x > 0:
        s = '{:1.0f}K'.format(x*1e-3)
    else:
        s = '{:1.0f}'.format(x)
    return s
ax.yaxis.set_major_formatter(number_formatter)

#set chart source and copyright
plt.annotate('Source: UNHCR Refugee Data Finder', (0,0), (0, -25), xycoords='axes fraction', textcoords='offset points', va='top', color = '#666666', fontsize=9)
plt.annotate('©UNHCR, The UN Refugee Agency', (0,0), (0, -35), xycoords='axes fraction', textcoords='offset points', va='top', color = '#666666', fontsize=9)

#adjust chart margin and layout
fig.tight_layout()

# Save the figure to the specified path
fig.savefig('plot/slope-chart.png')

#show chart
plt.show()
