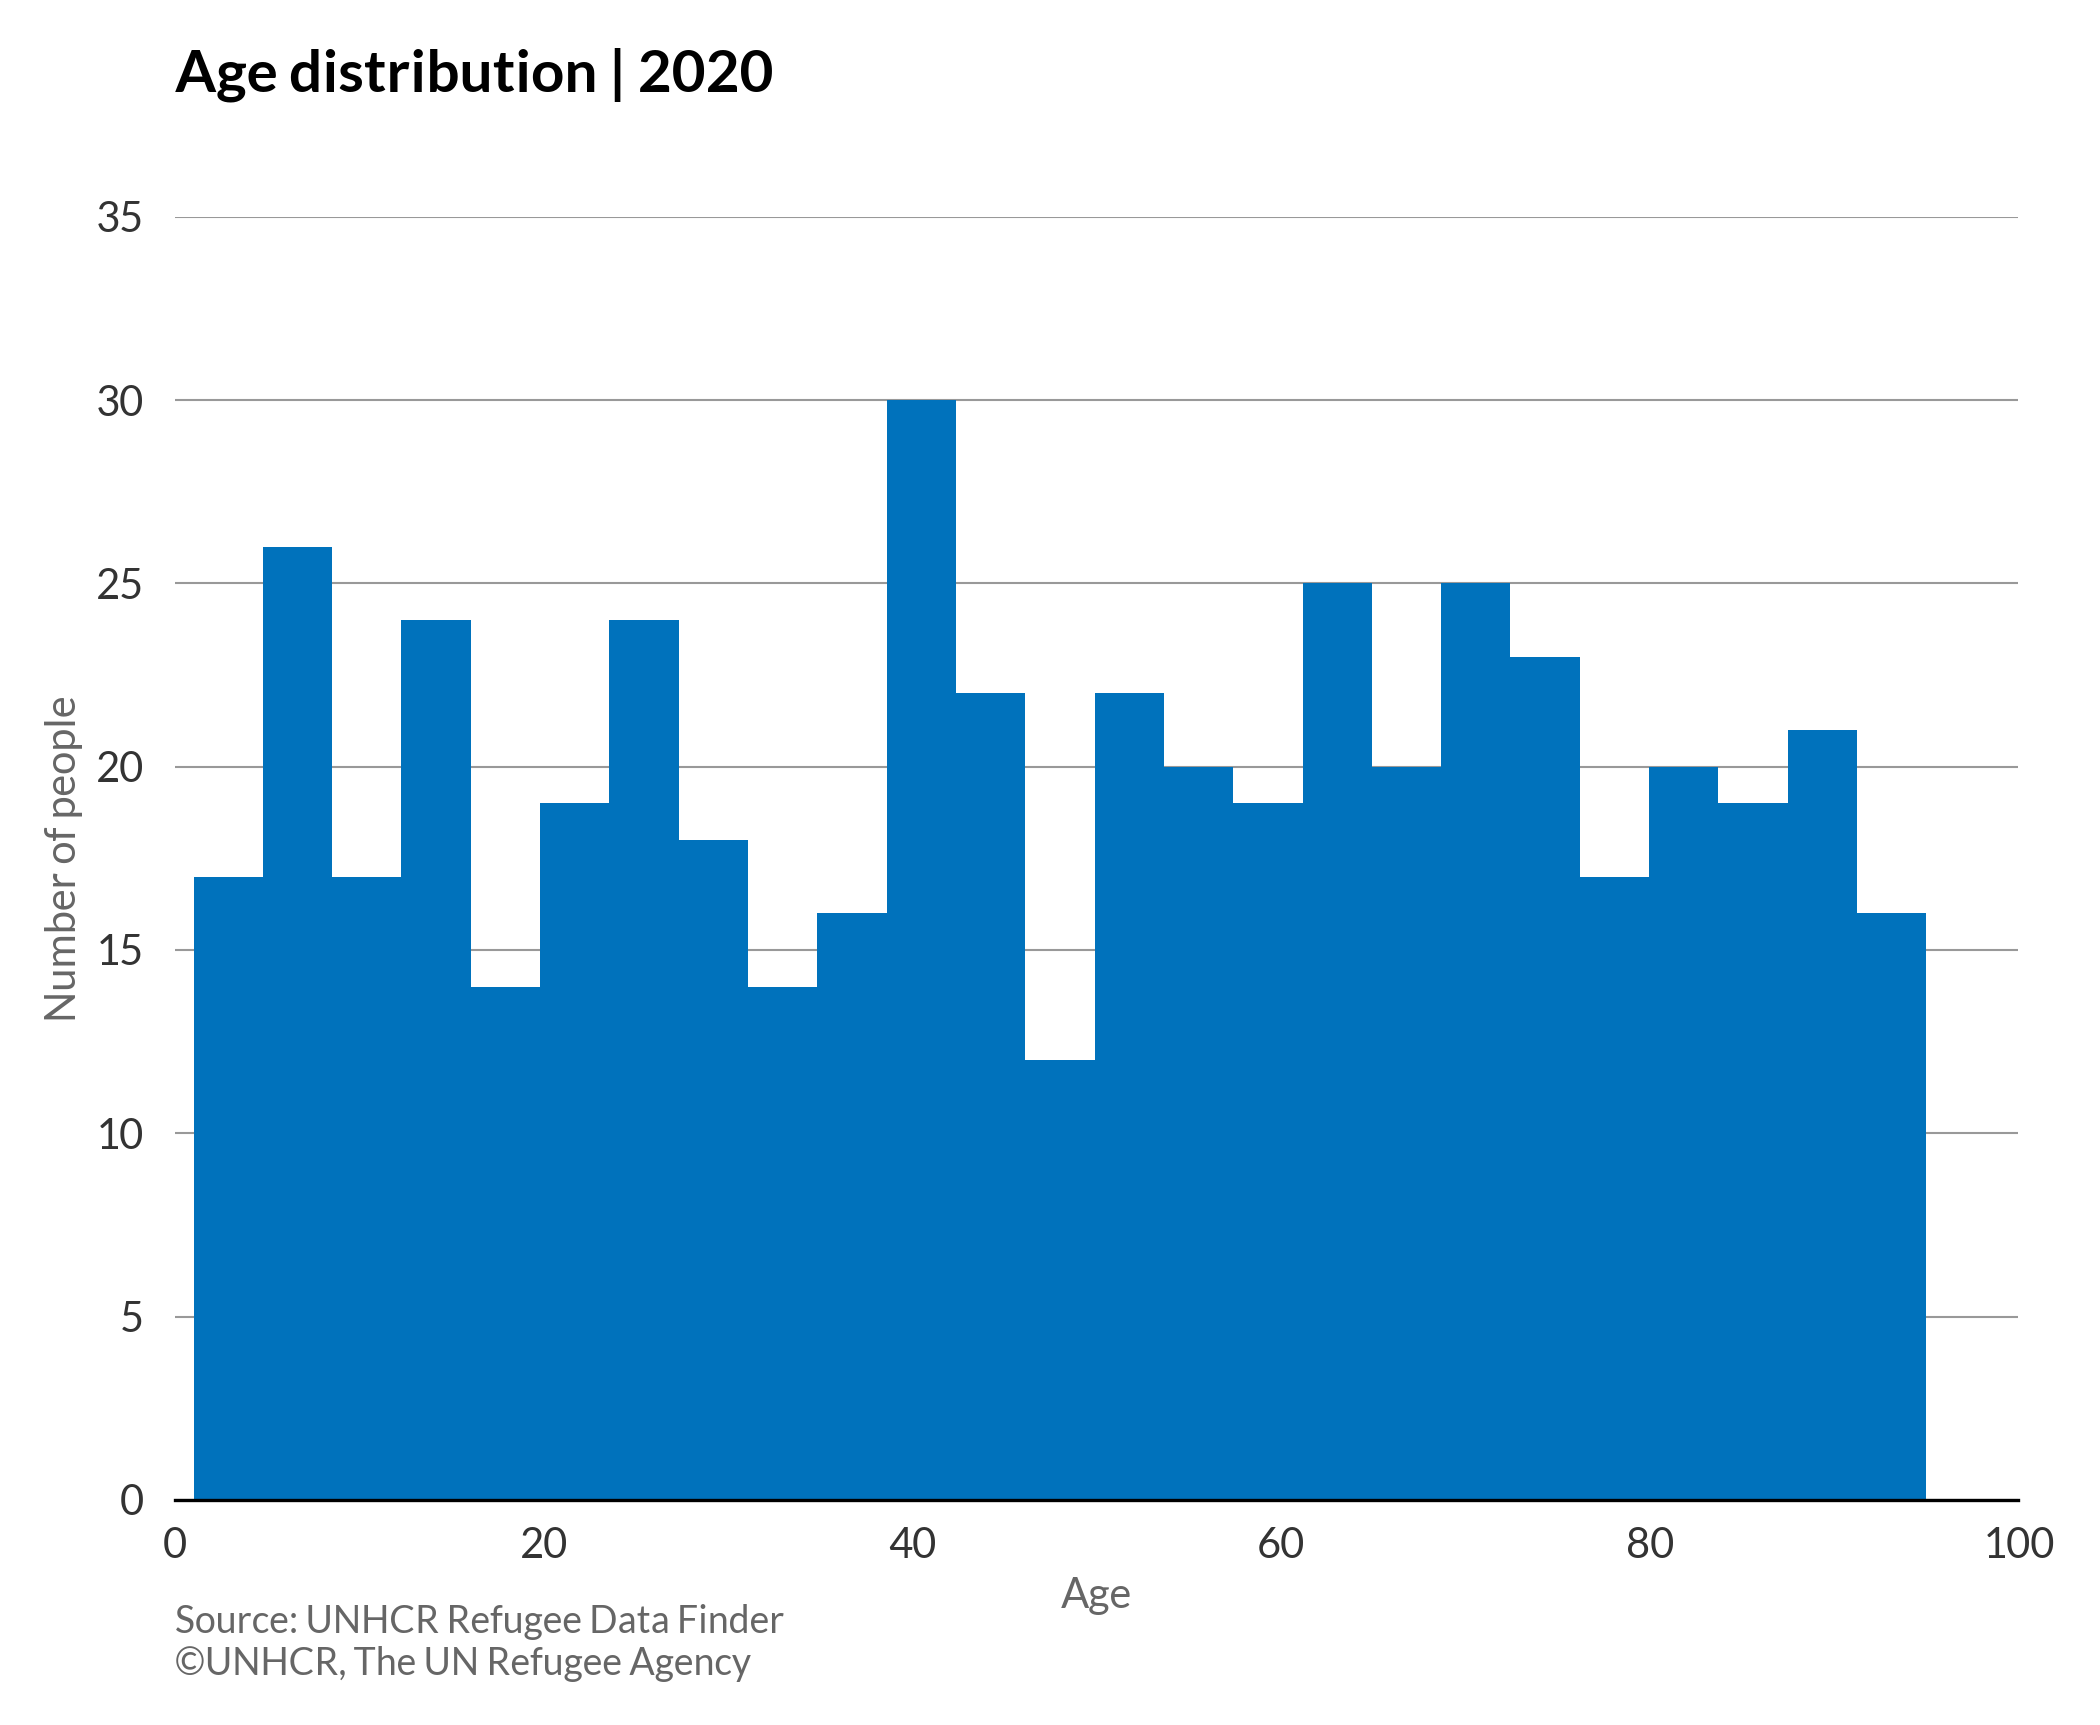
Histogram
A histogram displays the distribution of data over a continuous interval or specific time period. The height of each bar in a histogram indicates the frequency of data points within the interval/bin. It’s a great tool to identify where values are concentrated, or if there are extreme values or gaps in the dataset.
# import libraries
import matplotlib.pyplot as plt
import pandas as pd
plt.style.use(['unhcrpyplotstyle','histogram'])

#load data set
df = pd.read_csv('https://raw.githubusercontent.com/GDS-ODSSS/unhcr-dataviz-platform/master/data/distribution/histogram.csv')

#compute data array for plotting
x = df['poc_age']
num_bins = 25

#plot the chart
fig, ax = plt.subplots()
histo = ax.hist(x, num_bins)

#set x,y axis limits
xl = plt.xlim(0,100)
yl = plt.ylim(0,35)

#set chart title
ax.set_title('Age distribution | 2020')

#set axis label
ax.set_ylabel('Number of people')
ax.set_xlabel('Age')

#set chart source and copyright
plt.annotate('Source: UNHCR Refugee Data Finder', (0,0), (0, -25), xycoords='axes fraction', textcoords='offset points', va='top', color = '#666666', fontsize=9)
plt.annotate('©UNHCR, The UN Refugee Agency', (0,0), (0, -35), xycoords='axes fraction', textcoords='offset points', va='top', color = '#666666', fontsize=9)

#adjust chart margin and layout
fig.tight_layout()

# Save the figure to the specified path
fig.savefig('plot/histogram.png')

#show chart
plt.show()
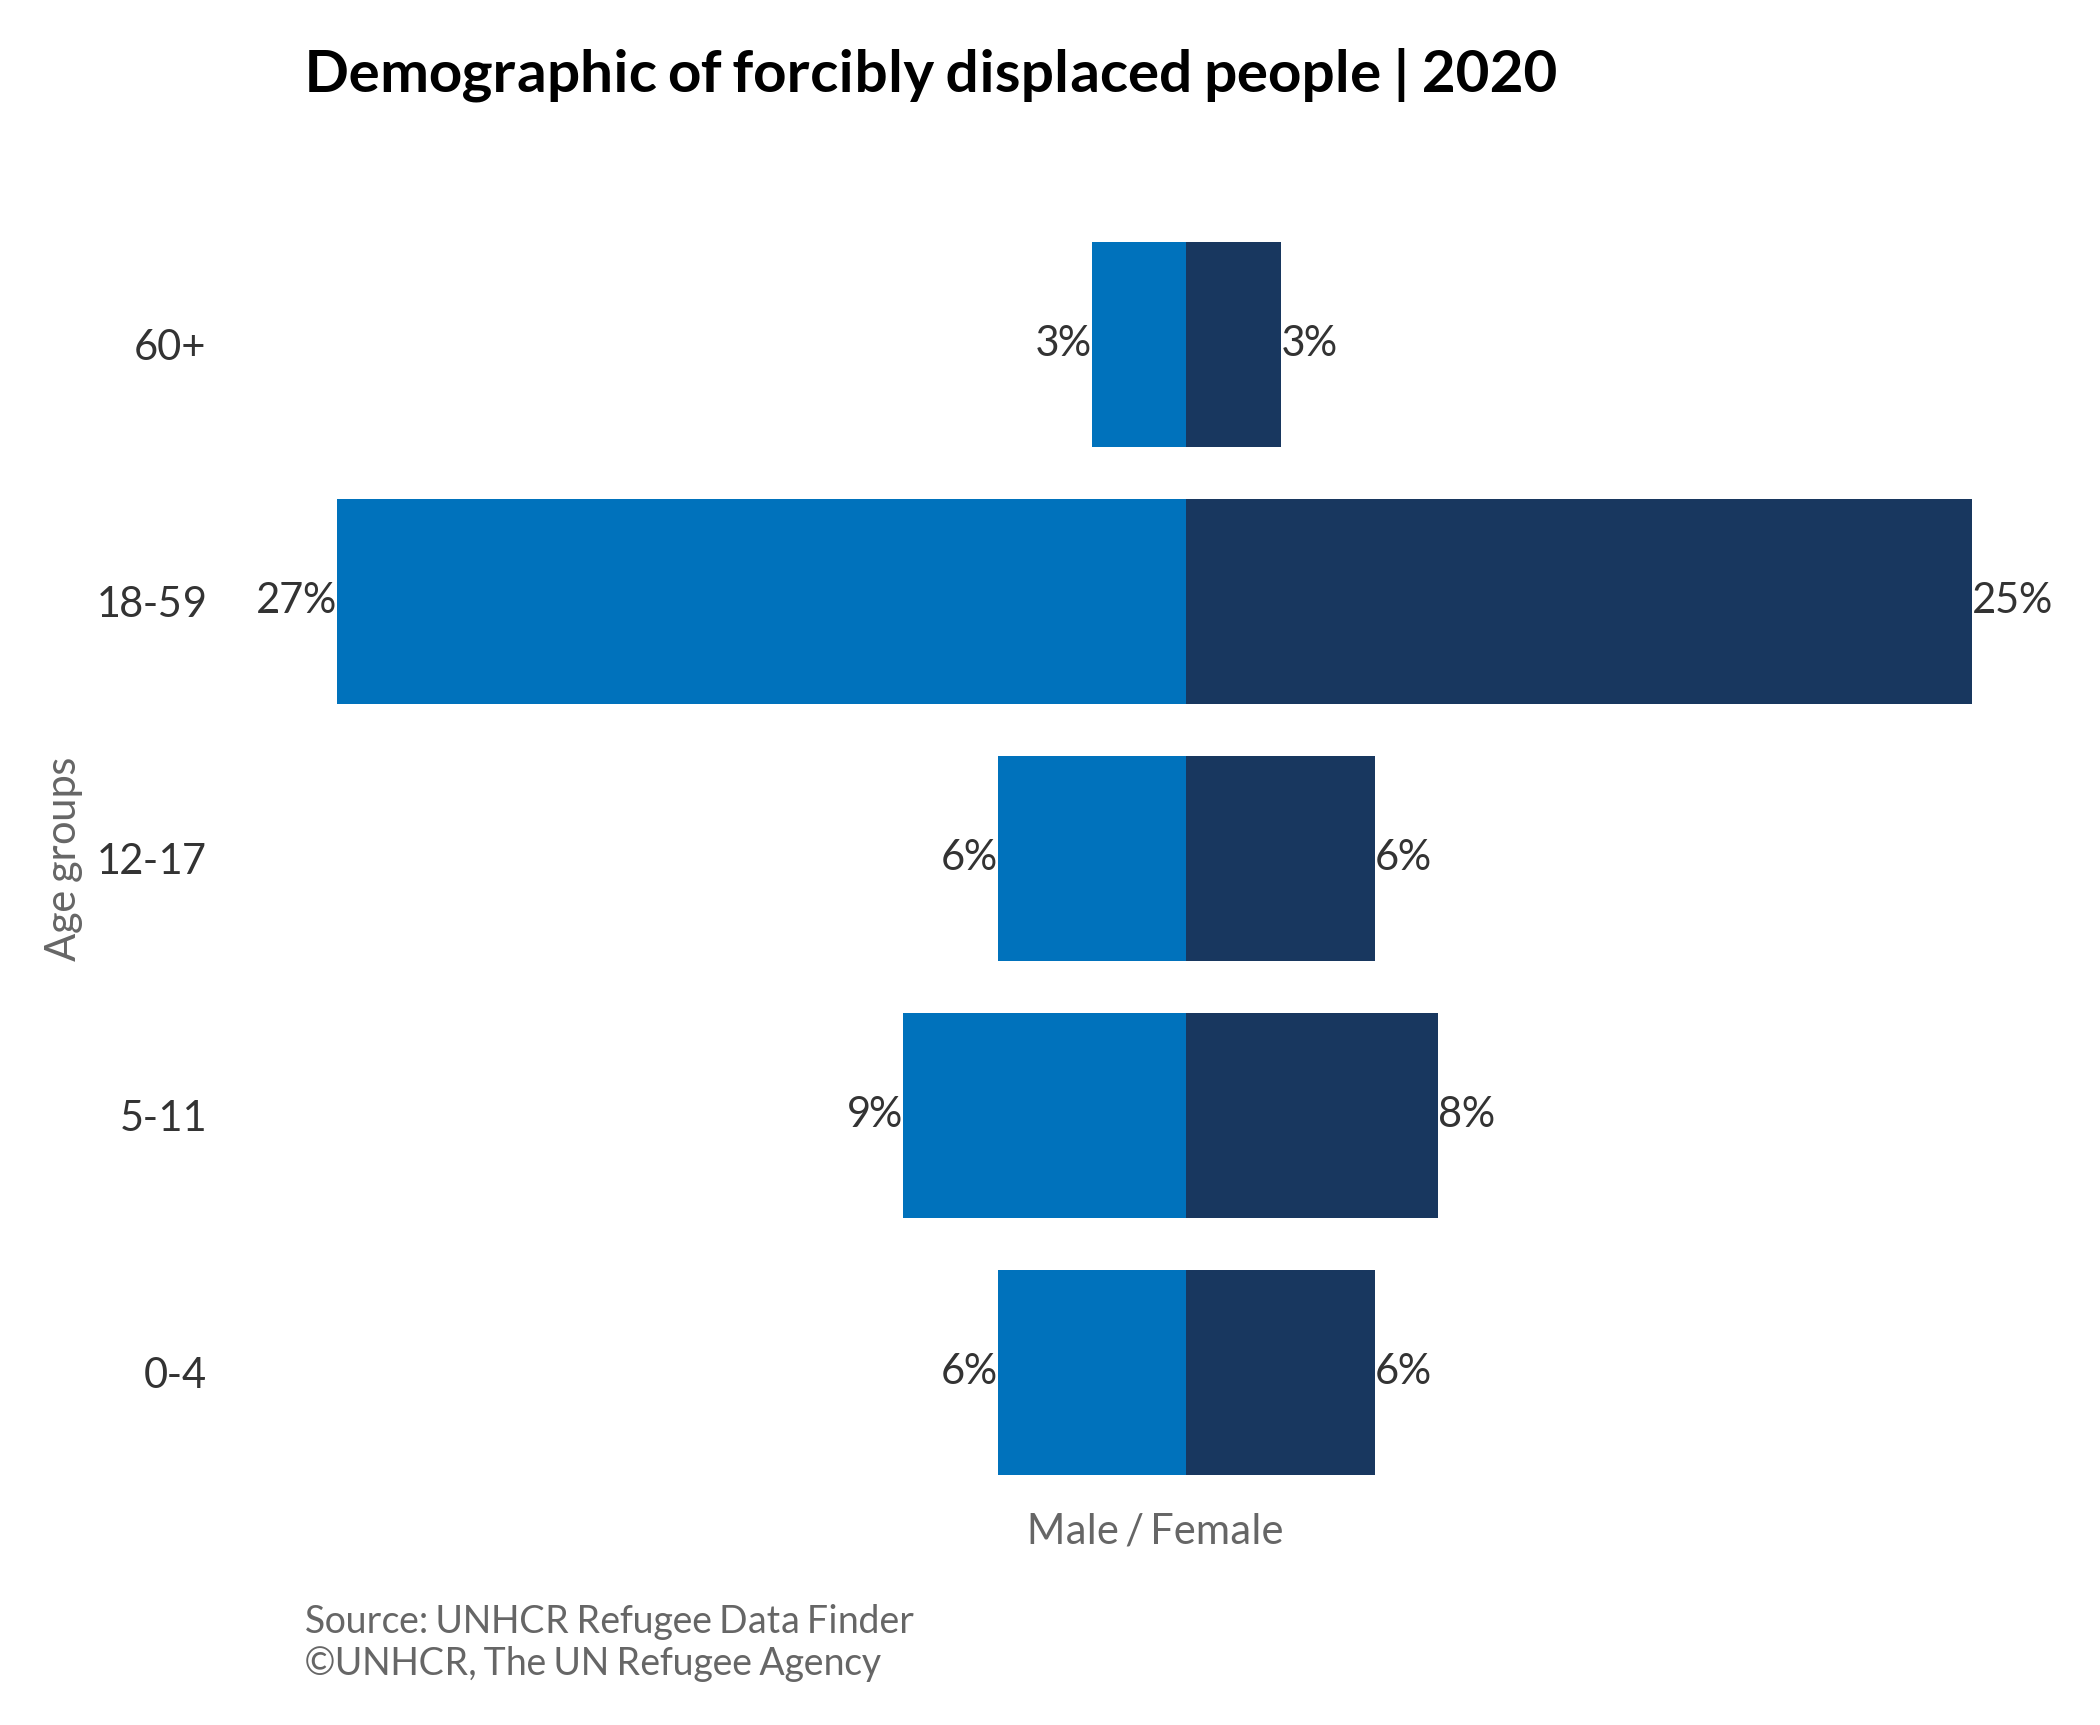
Population pyramid
A population pyramid consists of two histograms, one for each gender (conventionally, males on the left and females on the right) where the population numbers are shown horizontally (X-axis) and the age vertically (Y-axis). The values can be displayed either as a percentage of the total population or as a raw number.
More about: Population pyramid - Other tutorials: R D3
# import libraries
import matplotlib.pyplot as plt
import pandas as pd
plt.style.use(['unhcrpyplotstyle','population_pyramid'])

#load data set
df = pd.read_csv('https://raw.githubusercontent.com/GDS-ODSSS/unhcr-dataviz-platform/master/data/distribution/population_pyramid.csv')

#compute data array for plotting
x_male = df['male'] / -1
x_female = df['female']
y = df['ages']

#plot the chart
fig, ax = plt.subplots()
ax1 = ax.barh(y, x_male)
ax2 = ax.barh(y, x_female)

ax.bar_label(ax1, labels=[f'{x*100:,.0f}%' for x in -ax1.datavalues])
ax.bar_label(ax2, labels=[f'{x*100:,.0f}%' for x in ax2.datavalues])

#set chart title
ax.set_title('Demographic of forcibly displaced people | 2020')

#set axis label
ax.set_ylabel('Age groups')
ax.set_xlabel('Male / Female')

#set chart source and copyright
plt.annotate('Source: UNHCR Refugee Data Finder', (0,0), (0, -25), xycoords='axes fraction', textcoords='offset points', va='top', color = '#666666', fontsize=9)
plt.annotate('©UNHCR, The UN Refugee Agency', (0,0), (0, -35), xycoords='axes fraction', textcoords='offset points', va='top', color = '#666666', fontsize=9)

#adjust chart margin and layout
fig.tight_layout()

# Save the figure to the specified path
fig.savefig('plot/population-pyramid.png')

#show chart
plt.show()